Omron HBF-510W Instruction Manual - Page 27
Understanding Your Measurement Results
 |
View all Omron HBF-510W manuals
Add to My Manuals
Save this manual to your list of manuals |
Page 27 highlights
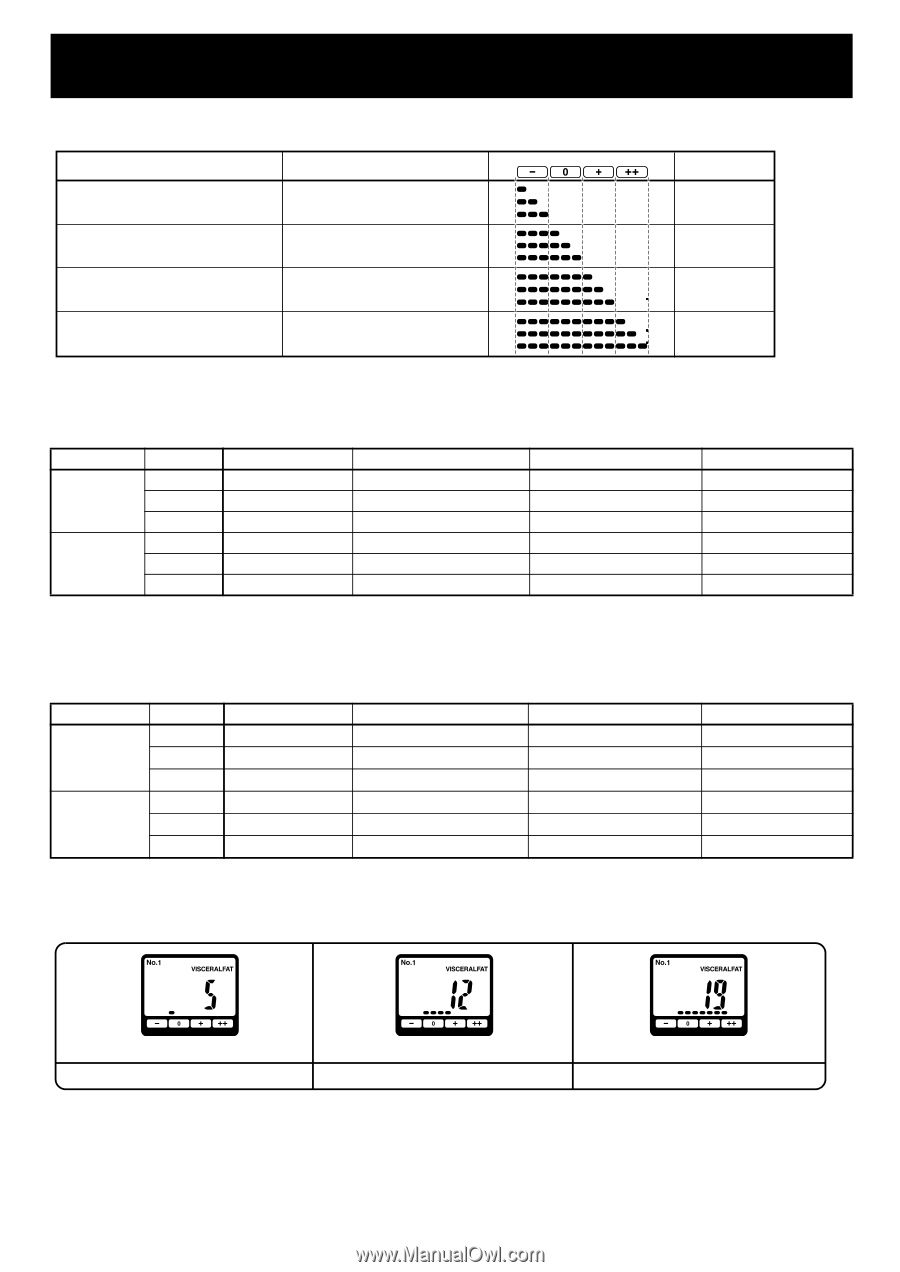
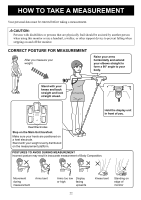
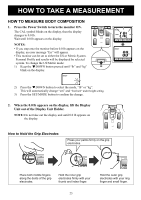
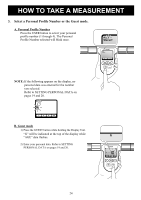
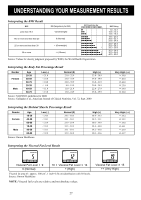
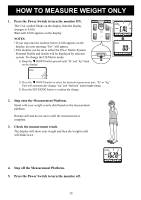
UNDERSTANDING YOUR MEASUREMENT RESULTS Interpreting the BMI Result BMI Less than 18.5 BMI (Designation by the WHO) - (Underweight) BMI Classification Bar 18.5 or more and less than 25 0 (Normal) 25 or more and less than 30 + (Overweight) 30 or more ++ (Obese) Source: Values for obesity judgment proposed by WHO, the World Health Organization. Interpreting the Body Fat Percentage Result Gender Age Low (-) Normal (0) High (+) Female Male 20-39 40-59 60-79 20-39 40-59 60-79 < 21.0 < 23.0 < 24.0 < 8.0 < 11.0 < 13.0 21.0 - 32.9 23.0 - 33.9 24.0 - 35.9 8.0 - 19.9 11.0 - 21.9 13.0 - 24.9 33.0 - 38.9 34.0 - 39.9 36.0 - 41.9 20.0 - 24.9 22.0 - 27.9 25.0 - 29.9 Source: NIH/WHO guidelines for BMI Source: Gallagher et al., American Journal of Clinical Nutrition, Vol. 72, Sept. 2000 Interpreting the Skeletal Muscle Percentage Result Gender Age 18-39 Female 40-59 60-80 18-39 Male 40-59 60-80 Source: Omron Healthcare Low (-) < 24.3 < 24.1 < 23.9 < 33.3 < 33.1 < 32.9 Normal (0) 24.3 - 30.3 24.1 - 30.1 23.9 - 29.9 33.3 - 39.3 33.1 - 39.1 32.9 - 38.9 High (+) 30.4 - 35.3 30.2 - 35.1 30.0 - 34.9 39.4 - 44.0 39.2 - 43.8 39.0 - 43.6 Interpreting the Visceral Fat Level Result BMI Rating 7.0 - 10.7 10.8 - 14.5 14.6 - 18.4 18.5 - 20.5 20.6 - 22.7 22.8 - 24.9 25.0 - 26.5 26.6 - 28.2 28.3 - 29.9 30.0 - 34.9 35.0 - 39.9 40.0 - 90.0 Very High (++) >_ 39.0 >_ 40.0 >_ 42.0 >_ 25.0 >_ 28.0 >_ 30.0 Very High (++) >_ 35.4 >_ 35.2 >_ 35.0 >_ 44.1 >_ 43.9 >_ 43.7 Visceral Fat Level
-
 1
1 -
2
-
3
-
4
-
5
-
6
-
7
-
8
-
9
-
10
-
11
-
12
-
13
-
14
-
15
-
16
-
17
-
18
-
19
-
20
-
21
-
 22
22 -
 23
23 -
 24
24 -
 25
25 -
 26
26 -
 27
27 -
 28
28 -
 29
29 -
 30
30 -
 31
31 -
 32
32 -
33
-
34
-
35
-
36
 |
 |