Texas Instruments TI-34 II Teachers Guide - Page 29
WNBA Stats-2-Variable Statistics - explorer
 |
View all Texas Instruments TI-34 II manuals
Add to My Manuals
Save this manual to your list of manuals |
Page 29 highlights
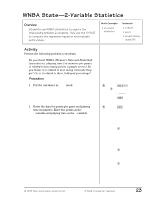
WNBA Stats-2-Variable Statistics Overview Students use WNBA Statistics to explore the relationship between 2 variables. They use the TI-34 Û to compute the regression equation and evaluate some values. Math Concepts • 2-variable statistics Materials • TI-34 Û • pencil • student activity (page 26) Activity Present the following problem to students: Do you think WNBA (Women's National Basketball Association) playing time (in minutes per game) is related to how many points a player scores? Do you think it is related to how many rebounds they get? Or is it related to their field-goal percentage? Procedure 1. Put the calculator in STAT mode. 1. Press % t and press " to select 2 -VAR. 1-VAR 2-VAR 2. Press
-
 1
1 -
2
-
3
-
4
-
5
-
6
-
7
-
8
-
9
-
10
-
11
-
12
-
13
-
14
-
15
-
16
-
17
-
18
-
19
-
20
-
21
-
22
-
23
-
 24
24 -
 25
25 -
 26
26 -
 27
27 -
 28
28 -
 29
29 -
 30
30 -
 31
31 -
 32
32 -
 33
33 -
 34
34 -
35
-
36
-
37
-
38
-
39
-
40
-
41
-
42
-
43
-
44
-
45
-
46
-
47
-
48
-
49
-
50
-
51
-
52
-
53
-
54
-
55
-
56
-
57
-
58
-
59
-
60
-
61
-
62
-
63
-
64
-
65
-
66
-
67
-
68
-
69
-
70
-
71
-
72
-
73
-
74
-
75
-
76
-
77
-
78
-
79
-
80
-
81
-
82
-
83
-
84
-
85
-
86
-
87
-
88
-
89
-
90
-
91
-
92
-
93
-
94
-
95
-
96
-
97
-
98
-
99
-
100
-
101
-
102
-
103
-
104
-
105
-
106
-
107
-
108
-
109
-
110
-
111
-
112
-
113
-
114
-
115
-
116
-
117
-
118
-
119
-
120
-
121
-
122
-
123
-
124
-
125
-
126
-
127
-
128
-
129
-
130
-
131
-
132
-
133
-
134
-
135
-
136
-
137
 |
 |

© 1999 T
EXAS
I
NSTRUMENTS
I
NCORPORATED
TI-34
Û
: A Guide for Teachers
23
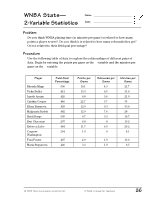
WNBA Stats—2-Variable Statistics
Overview
Students use WNBA Statistics to explore the
relationship between 2 variables. They use the TI
-
34
Û
to compute the regression equation and evaluate
some values.
Math Concepts
• 2-variable
statistics
Materials
• TI
-
34
Û
• pencil
• student activity
(page 26)
Activity
Present the following problem to students:
Do you think WNBA (Women’s National Basketball
Association)
playing time (in minutes per game)
is related to how many points a player scores? Do
you think it is related to how many rebounds they
get? Or is it related to their field-goal percentage?
Procedure
1.
Put the calculator in
STAT
mode.
2.
Enter the data for points per game and playing
time in minutes. Enter the points as the
X
-variable and playing time as the
Y
-variable.
±
1.
Press
%
t
and press
"
to select
2 -VAR
.
1-VAR
2-VAR
2.
Press
<
.
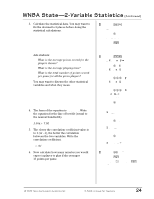
±
1.
Press
v
.
X1=
2.
Enter
10.1
(Rhonda
Mapp’s points).
X1=10.1
3.
Press
$
.
Y1=1
4.
Enter
21.7
(Rhonda
Mapp’s playing time).
Y1=21.7
5.
Press
$
to enter the data
for the second player.
6.
Continue to enter data for
each player in the chart.
Press
$
after entering
each number.