Texas Instruments TI-84 PLUS Guidebook - Page 85
Exploring Graphs with the Free-Moving Cursor, Exploring Graphs with TRACE, Free-Moving Cursor
 |
UPC - 033317192120
View all Texas Instruments TI-84 PLUS manuals
Add to My Manuals
Save this manual to your list of manuals |
Page 85 highlights
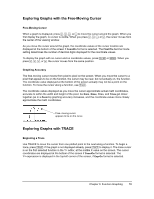
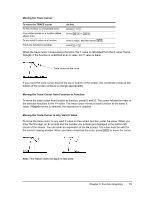
Exploring Graphs with the Free-Moving Cursor Free-Moving Cursor When a graph is displayed, press |, ~, }, or † to move the cursor around the graph. When you first display the graph, no cursor is visible. When you press |, ~, }, or †, the cursor moves from the center of the viewing window. As you move the cursor around the graph, the coordinate values of the cursor location are displayed at the bottom of the screen if CoordOn format is selected. The Float/Fix decimal mode setting determines the number of decimal digits displayed for the coordinate values. To display the graph with no cursor and no coordinate values, press ' or Í. When you press |, ~, }, or †, the cursor moves from the same position. Graphing Accuracy The free-moving cursor moves from pixel to pixel on the screen. When you move the cursor to a pixel that appears to be on the function, the cursor may be near, but not actually on, the function. The coordinate value displayed at the bottom of the screen actually may not be a point on the function. To move the cursor along a function, use r. The coordinate values displayed as you move the cursor approximate actual math coordinates, accurate to within the width and height of the pixel. As Xmin, Xmax, Ymin, and Ymax get closer together (as in a Zoom In) graphing accuracy increases, and the coordinate values more closely approximate the math coordinates. Free- moving cursor appears to be on the curve Exploring Graphs with TRACE Beginning a Trace Use TRACE to move the cursor from one plotted point to the next along a function. To begin a trace, press r. If the graph is not displayed already, press r to display it. The trace cursor is on the first selected function in the Y= editor, at the middle X value on the screen. The cursor coordinates are displayed at the bottom of the screen if CoordOn format is selected. The Y= expression is displayed in the top-left corner of the screen, if ExprOn format is selected. Chapter 3: Function Graphing 78
-
 1
1 -
2
-
3
-
4
-
5
-
6
-
7
-
8
-
9
-
10
-
11
-
12
-
13
-
14
-
15
-
16
-
17
-
18
-
19
-
20
-
21
-
22
-
23
-
24
-
25
-
26
-
27
-
28
-
29
-
30
-
31
-
32
-
33
-
34
-
35
-
36
-
37
-
38
-
39
-
40
-
41
-
42
-
43
-
44
-
45
-
46
-
47
-
48
-
49
-
50
-
51
-
52
-
53
-
54
-
55
-
56
-
57
-
58
-
59
-
60
-
61
-
62
-
63
-
64
-
65
-
66
-
67
-
68
-
69
-
70
-
71
-
72
-
73
-
74
-
75
-
76
-
77
-
78
-
79
-
 80
80 -
 81
81 -
 82
82 -
 83
83 -
 84
84 -
 85
85 -
 86
86 -
 87
87 -
 88
88 -
 89
89 -
 90
90 -
91
-
92
-
93
-
94
-
95
-
96
-
97
-
98
-
99
-
100
-
101
-
102
-
103
-
104
-
105
-
106
-
107
-
108
-
109
-
110
-
111
-
112
-
113
-
114
-
115
-
116
-
117
-
118
-
119
-
120
-
121
-
122
-
123
-
124
-
125
-
126
-
127
-
128
-
129
-
130
-
131
-
132
-
133
-
134
-
135
-
136
-
137
-
138
-
139
-
140
-
141
-
142
-
143
-
144
-
145
-
146
-
147
-
148
-
149
-
150
-
151
-
152
-
153
-
154
-
155
-
156
-
157
-
158
-
159
-
160
-
161
-
162
-
163
-
164
-
165
-
166
-
167
-
168
-
169
-
170
-
171
-
172
-
173
-
174
-
175
-
176
-
177
-
178
-
179
-
180
-
181
-
182
-
183
-
184
-
185
-
186
-
187
-
188
-
189
-
190
-
191
-
192
-
193
-
194
-
195
-
196
-
197
-
198
-
199
-
200
-
201
-
202
-
203
-
204
-
205
-
206
-
207
-
208
-
209
-
210
-
211
-
212
-
213
-
214
-
215
-
216
-
217
-
218
-
219
-
220
-
221
-
222
-
223
-
224
-
225
-
226
-
227
-
228
-
229
-
230
-
231
-
232
-
233
-
234
-
235
-
236
-
237
-
238
-
239
-
240
-
241
-
242
-
243
-
244
-
245
-
246
-
247
-
248
-
249
-
250
-
251
-
252
-
253
-
254
-
255
-
256
-
257
-
258
-
259
-
260
-
261
-
262
-
263
-
264
-
265
-
266
-
267
-
268
-
269
-
270
-
271
-
272
-
273
-
274
-
275
-
276
-
277
-
278
-
279
-
280
-
281
-
282
-
283
-
284
-
285
-
286
-
287
-
288
-
289
-
290
-
291
-
292
-
293
-
294
-
295
-
296
-
297
-
298
-
299
-
300
-
301
-
302
-
303
-
304
-
305
-
306
-
307
-
308
-
309
-
310
-
311
-
312
-
313
-
314
-
315
-
316
-
317
-
318
-
319
-
320
-
321
-
322
-
323
-
324
-
325
-
326
-
327
-
328
-
329
-
330
-
331
-
332
-
333
-
334
-
335
-
336
-
337
-
338
-
339
-
340
-
341
-
342
-
343
-
344
-
345
-
346
-
347
-
348
-
349
-
350
-
351
-
352
-
353
-
354
-
355
-
356
-
357
-
358
-
359
-
360
-
361
-
362
-
363
-
364
-
365
-
366
-
367
-
368
-
369
-
370
-
371
-
372
-
373
-
374
-
375
-
376
-
377
-
378
-
379
-
380
-
381
-
382
-
383
-
384
-
385
-
386
-
387
-
388
-
389
-
390
-
391
-
392
-
393
-
394
-
395
-
396
-
397
-
398
-
399
-
400
-
401
-
402
-
403
-
404
-
405
-
406
-
407
-
408
-
409
-
410
-
411
-
412
-
413
-
414
-
415
-
416
-
417
-
418
-
419
-
420
-
421
-
422
 |
 |
