D-Link DGS-3024 Product Manual - Page 131
Port Utilization, MONITORING
 |
UPC - 790069273889
View all D-Link DGS-3024 manuals
Add to My Manuals
Save this manual to your list of manuals |
Page 131 highlights
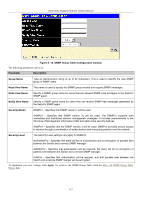
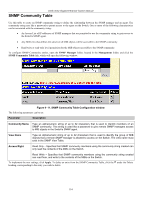
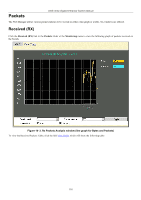
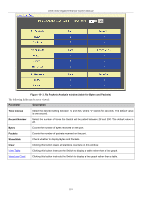
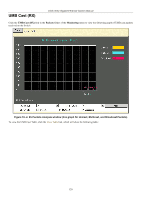
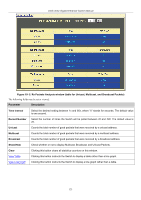
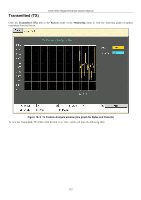
DGS-3024 Gigabit Ethernet Switch Manual 10 MONITORING The fourth Web Manager main folder is Monitoring and includes the following windows and sub-folders: Port Utilization, Packets, Errors, Size, MAC Address, Switch History Log, IGMP Snooping Group, IGMP Snooping Forwarding, VLAN Status, Router Port, Session Table, and Port Access Control, as well as secondary windows. Port Utilization The Utilization window displays the percentage of the total available bandwidth being used on the port. To view the port utilization, open the Monitoring folder and then click the Port Utilization link: The following fields can be set: Parameter Description Figure 10- 1. Utilization window Time Interval Select the desired setting between 1s and 60s, where "s" stands for seconds. The default value is one second. Record Number Select the number of times the Switch will be polled between 20 and 200. The default value is 200. Utilization The percentage of the total available bandwidth being used on the port. Show/Hide Check whether or not to display Utilization. Clear Clicking this button clears all statistics counters on this window. Click Apply to implement changes made. 117
-
 1
1 -
2
-
3
-
4
-
5
-
6
-
7
-
8
-
9
-
10
-
11
-
12
-
13
-
14
-
15
-
16
-
17
-
18
-
19
-
20
-
21
-
22
-
23
-
24
-
25
-
26
-
27
-
28
-
29
-
30
-
31
-
32
-
33
-
34
-
35
-
36
-
37
-
38
-
39
-
40
-
41
-
42
-
43
-
44
-
45
-
46
-
47
-
48
-
49
-
50
-
51
-
52
-
53
-
54
-
55
-
56
-
57
-
58
-
59
-
60
-
61
-
62
-
63
-
64
-
65
-
66
-
67
-
68
-
69
-
70
-
71
-
72
-
73
-
74
-
75
-
76
-
77
-
78
-
79
-
80
-
81
-
82
-
83
-
84
-
85
-
86
-
87
-
88
-
89
-
90
-
91
-
92
-
93
-
94
-
95
-
96
-
97
-
98
-
99
-
100
-
101
-
102
-
103
-
104
-
105
-
106
-
107
-
108
-
109
-
110
-
111
-
112
-
113
-
114
-
115
-
116
-
117
-
118
-
119
-
120
-
121
-
122
-
123
-
124
-
125
-
 126
126 -
 127
127 -
 128
128 -
 129
129 -
 130
130 -
 131
131 -
 132
132 -
 133
133 -
 134
134 -
 135
135 -
 136
136 -
137
-
138
-
139
-
140
-
141
-
142
-
143
-
144
-
145
-
146
-
147
-
148
-
149
-
150
-
151
-
152
-
153
-
154
-
155
-
156
-
157
-
158
-
159
-
160
-
161
-
162
-
163
-
164
-
165
-
166
-
167
-
168
-
169
-
170
-
171
-
172
-
173
-
174
-
175
-
176
-
177
-
178
-
179
-
180
-
181
-
182
-
183
-
184
-
185
-
186
-
187
-
188
-
189
-
190
-
191
-
192
-
193
-
194
-
195
-
196
-
197
-
198
-
199
-
200
-
201
-
202
-
203
-
204
-
205
-
206
-
207
-
208
 |
 |