Fluke 83V FE 83V & 87V Users Manual - Page 38
Determining Pulse Width, Bar Graph
 |
View all Fluke 83V manuals
Add to My Manuals
Save this manual to your list of manuals |
Page 38 highlights
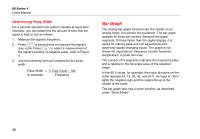
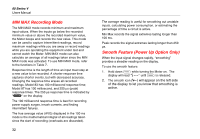
80 Series V Users Manual Determining Pulse Width For a periodic waveform (its pattern repeats at equal time intervals), you can determine the amount of time that the signal is high or low as follows: 1. Measure the signal's frequency. 2. Press Ga second time to measure the signal's duty cycle. Press E to select a measurement of the signal's positive or negative pulse, refer to Figure 9. 3. Use the following formula to determine the pulse width: Pulse Width = % Duty Cycle ÷ 100 (in seconds) Frequency Bar Graph The analog bar graph functions like the needle on an analog meter, but without the overshoot. The bar graph updates 40 times per second. Because the graph responds 10 times faster than the digital display, it is useful for making peak and null adjustments and observing rapidly changing inputs. The graph is not shown for capacitance, frequency counter functions, temperature, or peak min max. The number of lit segments indicates the measured value and is relative to the full-scale value of the selected range. In the 60 V range, for example, the major divisions on the scale represent 0, 15, 30, 45, and 60 V. An input of -30 V lights the negative sign and the segments up to the middle of the scale. The bar graph also has a zoom function, as described under "Zoom Mode". 30
-
 1
1 -
2
-
3
-
4
-
5
-
6
-
7
-
8
-
9
-
10
-
11
-
12
-
13
-
14
-
15
-
16
-
17
-
18
-
19
-
20
-
21
-
22
-
23
-
24
-
25
-
26
-
27
-
28
-
29
-
30
-
31
-
32
-
 33
33 -
 34
34 -
 35
35 -
 36
36 -
 37
37 -
 38
38 -
 39
39 -
 40
40 -
 41
41 -
 42
42 -
 43
43 -
44
-
45
-
46
-
47
-
48
-
49
-
50
-
51
-
52
-
53
-
54
-
55
-
56
-
57
-
58
-
59
-
60
 |
 |