HP 39g hp 39g+ (39g & 40g)_mastering the hp 39g+_English_E_F2224-90010.pdf - Page 166
Self test mode, If you go to HP²s website you can download a worksheet for use with your
 |
View all HP 39g manuals
Add to My Manuals
Save this manual to your list of manuals |
Page 166 highlights
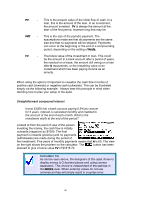
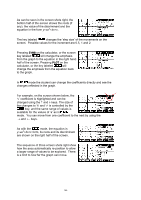
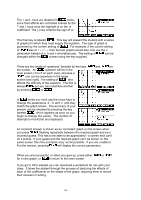
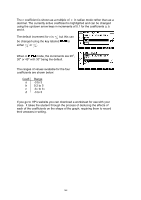
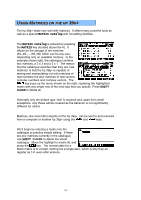
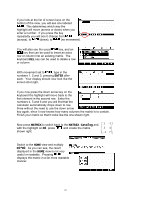
The + and - keys are disabled in mode, since their effects are controlled instead by the ↑ and ↓ keys once the highlight is on the 'a' coefficient. The (-) key controls the sign of 'a'. Self test mode The final key is labeled . This key will present the student with a series of graphs for which they must supply the equation. The type of graph is governed by the current setting of . For example, if the current setting of was at Y = X 2 + v then the test graphs would also only use the v parameter instead of a, h and v simultaneously. The setting of can be changed within the screen using the key supplied. There are two levels of 'questions' denoted by the keys and on the screen. An question will be in the main screen (-5 to 5 on each axis), whereas a one can be anywhere in the larger screen (see right). The setting of also affects the difficulty of the question. The first is always but you can substitute another by pressing or . In mode you must use the arrow keys to change the parameters 'a', 'h' and 'v' until they match the graph shown. The accuracy of your answer can be checked by pressing the key labeled , which appears as soon as you begin to change the values. The number of attempts is monitored and displayed. An incorrect answer is shown as an 'animated' graph on the screen when you press , flashing repeatedly between the required graph and your incorrect guess. This has to be seen to be appreciated - a screen shot can't do it justice. If your guess and the required graph can't be shown on the same screen then this animation may not be possible. If you are unable to find the answer, pressing will display the correct parameters. When you are successful, or when you give up, press either or for a new graph, or to return to the main screen. If you go to HP's website you can download a worksheet for use with your class. It takes the student through the process of deducing the effects of each of the coefficients on the shape of the graph, requiring them to record their answers in writing. 166
-
 1
1 -
2
-
3
-
4
-
5
-
6
-
7
-
8
-
9
-
10
-
11
-
12
-
13
-
14
-
15
-
16
-
17
-
18
-
19
-
20
-
21
-
22
-
23
-
24
-
25
-
26
-
27
-
28
-
29
-
30
-
31
-
32
-
33
-
34
-
35
-
36
-
37
-
38
-
39
-
40
-
41
-
42
-
43
-
44
-
45
-
46
-
47
-
48
-
49
-
50
-
51
-
52
-
53
-
54
-
55
-
56
-
57
-
58
-
59
-
60
-
61
-
62
-
63
-
64
-
65
-
66
-
67
-
68
-
69
-
70
-
71
-
72
-
73
-
74
-
75
-
76
-
77
-
78
-
79
-
80
-
81
-
82
-
83
-
84
-
85
-
86
-
87
-
88
-
89
-
90
-
91
-
92
-
93
-
94
-
95
-
96
-
97
-
98
-
99
-
100
-
101
-
102
-
103
-
104
-
105
-
106
-
107
-
108
-
109
-
110
-
111
-
112
-
113
-
114
-
115
-
116
-
117
-
118
-
119
-
120
-
121
-
122
-
123
-
124
-
125
-
126
-
127
-
128
-
129
-
130
-
131
-
132
-
133
-
134
-
135
-
136
-
137
-
138
-
139
-
140
-
141
-
142
-
143
-
144
-
145
-
146
-
147
-
148
-
149
-
150
-
151
-
152
-
153
-
154
-
155
-
156
-
157
-
158
-
159
-
160
-
 161
161 -
 162
162 -
 163
163 -
 164
164 -
 165
165 -
 166
166 -
 167
167 -
 168
168 -
 169
169 -
 170
170 -
 171
171 -
172
-
173
-
174
-
175
-
176
-
177
-
178
-
179
-
180
-
181
-
182
-
183
-
184
-
185
-
186
-
187
-
188
-
189
-
190
-
191
-
192
-
193
-
194
-
195
-
196
-
197
-
198
-
199
-
200
-
201
-
202
-
203
-
204
-
205
-
206
-
207
-
208
-
209
-
210
-
211
-
212
-
213
-
214
-
215
-
216
-
217
-
218
-
219
-
220
-
221
-
222
-
223
-
224
-
225
-
226
-
227
-
228
-
229
-
230
-
231
-
232
-
233
-
234
-
235
-
236
-
237
-
238
-
239
-
240
-
241
-
242
-
243
-
244
-
245
-
246
-
247
-
248
-
249
-
250
-
251
-
252
-
253
-
254
-
255
-
256
-
257
-
258
-
259
-
260
-
261
-
262
-
263
-
264
-
265
-
266
-
267
-
268
-
269
-
270
-
271
-
272
-
273
-
274
-
275
-
276
-
277
-
278
-
279
-
280
-
281
-
282
-
283
-
284
-
285
-
286
-
287
-
288
-
289
-
290
-
291
-
292
-
293
-
294
-
295
-
296
-
297
-
298
-
299
-
300
-
301
-
302
-
303
-
304
-
305
-
306
-
307
-
308
-
309
-
310
-
311
-
312
-
313
-
314
-
315
-
316
-
317
-
318
-
319
-
320
-
321
-
322
-
323
-
324
-
325
-
326
-
327
-
328
-
329
-
330
-
331
 |
 |
