HP ProLiant 3000 DSS Sizing and Tuning of Oracle8 for Windows NT on Compaq Ser - Page 5
DSS Sizing and Tuning of Oracle8 for Windows NT on CompaqServers
 |
View all HP ProLiant 3000 manuals
Add to My Manuals
Save this manual to your list of manuals |
Page 5 highlights
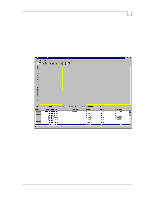
DSS Sizing and Tuning of Oracle8 for Windows NT on CompaqServers Page 3 1024. The Windows NT Performance Monitor displays the process (ORACLE80) and threads (Threads 0,1 represent the Oracle service threads). If ARCHIVELOG mode is enabled, threads 2,3,4,5,6,7,8 represent the background threads [PMON, DBWR, ARCH, LGWR, CKPT, SMON and RECO respectively]. If ARCHIVELOG mode is not enabled, threads 2,3,4,5,6,7 represent the background threads [PMON, DBWR, LGWR, CKPT, SMON and RECO respectively] as shown in Figure 1. The process ID for each thread is listed in the "Last", "Average", "Min" and "Max" boxes in Performance Monitor. Descriptions of each background thread can be found in Figure 3. Figure 1: Performance Monitor - Oracle8 Server process and threads The Oracle8 Server process is represented under Windows NT as a service (OracleServiceSSSS [SSSS= System ID]) associated with the executable ORACLE80.EXE. The Oracle Service consists of two threads, 0 and 1. Thread 0 is the Oracle process main thread acting as a service dispatcher and creating thread 1 to handle the service. Each Oracle instance is associated with a specific Windows NT service and consists of a single process and multiple threads. Use the Windows NT Control Panel/Services to display the Oracle Services. OracleServiceTPCD represents the Oracle Instance TPCD as shown in Figure 2. © 1998 Compaq Computer Corporation, All Rights Reserved Doc No ECG156/0398
-
 1
1 -
 2
2 -
 3
3 -
 4
4 -
 5
5 -
 6
6 -
 7
7 -
 8
8 -
 9
9 -
 10
10 -
 11
11 -
12
-
13
-
14
-
15
-
16
-
17
-
18
-
19
-
20
-
21
-
22
-
23
-
24
-
25
-
26
-
27
-
28
-
29
-
30
-
31
-
32
-
33
-
34
-
35
-
36
-
37
-
38
-
39
-
40
-
41
-
42
-
43
-
44
-
45
 |
 |
