HP ProLiant DL288 ISS Technology Update Volume 8, Number 6 - Page 2
Understanding and interpreting SPECpower_ssj2008 results
 |
View all HP ProLiant DL288 manuals
Add to My Manuals
Save this manual to your list of manuals |
Page 2 highlights
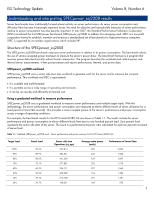
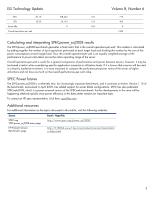
ISS Technology Update Volume 8, Number 6 Understanding and interpreting SPECpower_ssj2008 results Server benchmarks have traditionally focused almost entirely on server performance. As server power consumption and efficiency have become increasingly important issues, the need for objective and reproducible measures of server performance relative to power consumption has also become important. In late 2007, the Standard Performance Evaluation Corporation (SPEC) introduced the first SPECpower benchmark (SPECpower_ssj2008) to address this emerging need. SPEC is a non-profit corporation formed to establish, maintain and endorse a standardized set of benchmarks for high-performance computers. SPEC is supported by its member organizations which includes HP. Structure of the SPECpower_ssj2008 The SPECpower_ssj2008 benchmark measures server performance in relation to its power consumption. The benchmark allows the use of various accepted power analyzers to measure the server's power draw. The benchmark harness is a program that receives power data electronically without human intervention. The program launches the workload and collects power and thermal sensor measurements. It then post-processes and reports performance, thermal, and power data. SPECpower_ssj2008 workload SPECpower_ssj2008 uses a server side Java (ssj) workload to generate work for the server and to measure the compute performance. This workload met SPEC's requirements: It is scalable and multi-threaded. It is portable across a wide range of operating environments. It can be run quickly and efficiently at minimal cost. Using a graduated workload to measure performance SPECpower_ssj2008 uses a graduated workload to measure server performance and multiple target loads. With this methodology, the server performance and power consumption are measured at eleven different levels of server utilization for a fixed period of time (240 seconds). This provides a more complete picture of the server's performance and power consumption across a range of operating conditions. For example, the benchmark results for the HP ProLiant DL385 G6 are shown in Table 1-1. The results include the server performance and power consumption at eleven different levels from zero to one hundred percent load. Zero percent load represents the active idle state of the server. The result is a performance-to-power ratio calculated for each ten percent increment of server load. Table 1-1. Published SPECpower_ssj2008 result - Power performance and power summary for the HP ProLiant DL385 G6 Target Load 100% 90% 80% 70% 60% 50% 40% 30% Actual Load 99.4% 89.7% 80.0% 70.1% 60.2% 50.0% 39.7% 29.7% Server side Java Operations (ssj_ops) Average active power (watts) Performance to Power Ratio 535,814 260 2,062 483,541 246 1,962 431,269 234 1,847 377,831 220 1,715 324,171 207 1,565 269,338 194 1,386 213,708 181 1,181 160,021 168 953 2
-
 1
1 -
 2
2 -
 3
3 -
 4
4 -
 5
5 -
 6
6 -
 7
7
 |
 |