Lowrance HDS-7 LIVE HDS Live Operator Manual - Page 75
Overlay DownScan, Temperature graph, Depth line, Amplitude scope, Preview, Fish ID
 |
View all Lowrance HDS-7 LIVE manuals
Add to My Manuals
Save this manual to your list of manuals |
Page 75 highlights
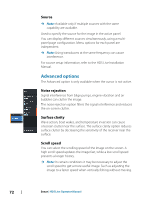
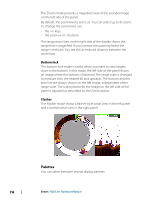
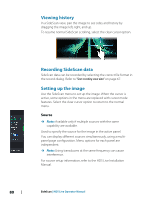
Overlay DownScan When a DownScan capable transducer is connected to your system, you can overlay DownScan images on the regular Sonar image. When overlay DownScan is activated, the Sonar panel menu expands to include basic DownScan options. Temperature graph The temperature graph is used to illustrate changes in water temperature. When toggled on, a colored line and temperature digits are shown on the Sonar image. Depth line A depth line can be added to the bottom surface to make it easier to distinguish the bottom from fish and structures. Amplitude scope The Amplitude scope is a display of real-time targets as they appear on the panel. The strength of the actual targets is indicated by both width and color intensity. Preview You can have all available sonar history shown at the top of the sonar screen. The Preview bar is a snapshot of available sonar history. You can scroll through sonar history by dragging the preview slider horizontally. By default, Preview is turned on when the cursor is active. Fish ID You can select how you want the fish targets to appear on the screen. You can also select if you want to be notified by a beep when a fish ID appears on the panel. Sonar | HDS Live Operator Manual 75
-
 1
1 -
2
-
3
-
4
-
5
-
6
-
7
-
8
-
9
-
10
-
11
-
12
-
13
-
14
-
15
-
16
-
17
-
18
-
19
-
20
-
21
-
22
-
23
-
24
-
25
-
26
-
27
-
28
-
29
-
30
-
31
-
32
-
33
-
34
-
35
-
36
-
37
-
38
-
39
-
40
-
41
-
42
-
43
-
44
-
45
-
46
-
47
-
48
-
49
-
50
-
51
-
52
-
53
-
54
-
55
-
56
-
57
-
58
-
59
-
60
-
61
-
62
-
63
-
64
-
65
-
66
-
67
-
68
-
69
-
 70
70 -
 71
71 -
 72
72 -
 73
73 -
 74
74 -
 75
75 -
 76
76 -
 77
77 -
 78
78 -
 79
79 -
 80
80 -
81
-
82
-
83
-
84
-
85
-
86
-
87
-
88
-
89
-
90
-
91
-
92
-
93
-
94
-
95
-
96
-
97
-
98
-
99
-
100
-
101
-
102
-
103
-
104
-
105
-
106
-
107
-
108
-
109
-
110
-
111
-
112
-
113
-
114
-
115
-
116
-
117
-
118
-
119
-
120
-
121
-
122
-
123
-
124
-
125
-
126
-
127
-
128
-
129
-
130
-
131
-
132
-
133
-
134
-
135
-
136
-
137
-
138
-
139
-
140
-
141
-
142
-
143
-
144
-
145
-
146
-
147
-
148
-
149
-
150
-
151
-
152
-
153
-
154
-
155
-
156
-
157
-
158
-
159
-
160
-
161
-
162
-
163
-
164
-
165
-
166
-
167
-
168
-
169
-
170
-
171
-
172
-
173
-
174
-
175
-
176
-
177
-
178
-
179
-
180
-
181
-
182
-
183
-
184
-
185
-
186
-
187
-
188
-
189
-
190
-
191
-
192
-
193
-
194
-
195
-
196
-
197
-
198
 |
 |
