Lowrance HDS-7 LIVE HDS Live Operator Manual - Page 86
Sensitivity, Colorline, Surface clarity, Palette, Range lines, Preview
 |
View all Lowrance HDS-7 LIVE manuals
Add to My Manuals
Save this manual to your list of manuals |
Page 86 highlights
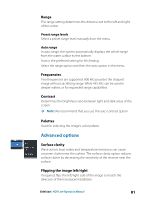
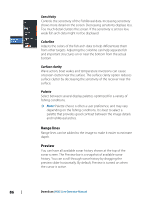
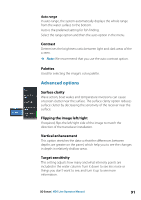
Sensitivity Controls the sensitivity of the FishReveal data. Increasing sensitivity shows more detail on the screen. Decreasing sensitivity displays less. Too much detail clutters the screen. If the sensitivity is set too low, weak fish arch data might not be displayed. Colorline Adjusts the colors of the fish arch data to help differentiate them from other targets. Adjusting the colorline can help separate fish and important structures on or near the bottom from the actual bottom. Surface clarity Wave action, boat wakes and temperature inversions can cause onscreen clutter near the surface. The surface clarity option reduces surface clutter by decreasing the sensitivity of the receiver near the surface. Palette Select between several display palettes optimized for a variety of fishing conditions. Ú Note: Palette choice is often a user preference, and may vary depending on the fishing conditions. It is best to select a palette that provides good contrast between the image details and FishReveal arches. Range lines Range lines can be added to the image to make it easier to estimate depth. Preview You can have all available sonar history shown at the top of the sonar screen. The Preview bar is a snapshot of available sonar history. You can scroll through sonar history by dragging the preview slider horizontally. By default, Preview is turned on when the cursor is active. 86 DownScan | HDS Live Operator Manual
-
 1
1 -
2
-
3
-
4
-
5
-
6
-
7
-
8
-
9
-
10
-
11
-
12
-
13
-
14
-
15
-
16
-
17
-
18
-
19
-
20
-
21
-
22
-
23
-
24
-
25
-
26
-
27
-
28
-
29
-
30
-
31
-
32
-
33
-
34
-
35
-
36
-
37
-
38
-
39
-
40
-
41
-
42
-
43
-
44
-
45
-
46
-
47
-
48
-
49
-
50
-
51
-
52
-
53
-
54
-
55
-
56
-
57
-
58
-
59
-
60
-
61
-
62
-
63
-
64
-
65
-
66
-
67
-
68
-
69
-
70
-
71
-
72
-
73
-
74
-
75
-
76
-
77
-
78
-
79
-
80
-
 81
81 -
 82
82 -
 83
83 -
 84
84 -
 85
85 -
 86
86 -
 87
87 -
 88
88 -
 89
89 -
 90
90 -
 91
91 -
92
-
93
-
94
-
95
-
96
-
97
-
98
-
99
-
100
-
101
-
102
-
103
-
104
-
105
-
106
-
107
-
108
-
109
-
110
-
111
-
112
-
113
-
114
-
115
-
116
-
117
-
118
-
119
-
120
-
121
-
122
-
123
-
124
-
125
-
126
-
127
-
128
-
129
-
130
-
131
-
132
-
133
-
134
-
135
-
136
-
137
-
138
-
139
-
140
-
141
-
142
-
143
-
144
-
145
-
146
-
147
-
148
-
149
-
150
-
151
-
152
-
153
-
154
-
155
-
156
-
157
-
158
-
159
-
160
-
161
-
162
-
163
-
164
-
165
-
166
-
167
-
168
-
169
-
170
-
171
-
172
-
173
-
174
-
175
-
176
-
177
-
178
-
179
-
180
-
181
-
182
-
183
-
184
-
185
-
186
-
187
-
188
-
189
-
190
-
191
-
192
-
193
-
194
-
195
-
196
-
197
-
198
 |
 |
