Panasonic HDCHS700 HDCHS700 User Guide - Page 77
HISTOGRAM], Example of the display
 |
UPC - 885170002722
View all Panasonic HDCHS700 manuals
Add to My Manuals
Save this manual to your list of manuals |
Page 77 highlights
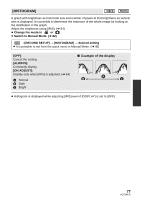
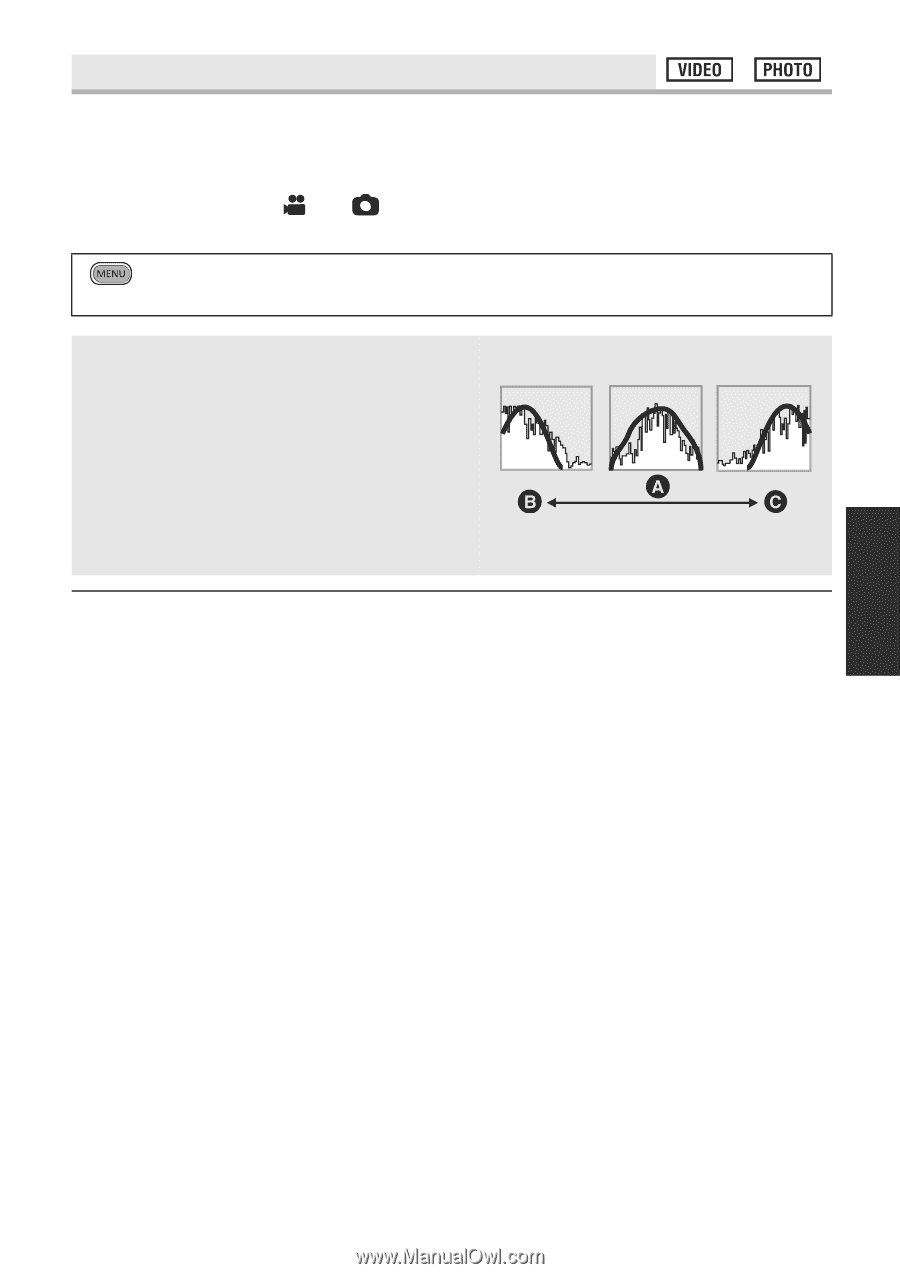
[HISTOGRAM] A graph with brightness as horizontal axis and number of pixels at that brightness as vertical axis is displayed. It is possible to determine the exposure of the whole image by looking at the distribution in the graph. Adjust the brightness using [IRIS]. (l 84) ≥ Change the mode to or . ≥ Switch to Manual Mode. (l 82) : [RECORD SETUP] # [HISTOGRAM] # desired setting ≥ It is possible to set from the quick menu in Manual Mode. (l 45) [OFF]: Cancel the setting. [ALWAYS]: Constantly display. [ON ADJUST]: Display only when [IRIS] is adjusted. (l 84) A Normal B Dark C Bright ∫ Example of the display ≥ Histogram is displayed while adjusting [IRIS] even if [DISPLAY] is set to [OFF]. 77 VQT2M75
-
 1
1 -
2
-
3
-
4
-
5
-
6
-
7
-
8
-
9
-
10
-
11
-
12
-
13
-
14
-
15
-
16
-
17
-
18
-
19
-
20
-
21
-
22
-
23
-
24
-
25
-
26
-
27
-
28
-
29
-
30
-
31
-
32
-
33
-
34
-
35
-
36
-
37
-
38
-
39
-
40
-
41
-
42
-
43
-
44
-
45
-
46
-
47
-
48
-
49
-
50
-
51
-
52
-
53
-
54
-
55
-
56
-
57
-
58
-
59
-
60
-
61
-
62
-
63
-
64
-
65
-
66
-
67
-
68
-
69
-
70
-
71
-
 72
72 -
 73
73 -
 74
74 -
 75
75 -
 76
76 -
 77
77 -
 78
78 -
 79
79 -
 80
80 -
 81
81 -
 82
82 -
83
-
84
-
85
-
86
-
87
-
88
-
89
-
90
-
91
-
92
-
93
-
94
-
95
-
96
-
97
-
98
-
99
-
100
-
101
-
102
-
103
-
104
-
105
-
106
-
107
-
108
-
109
-
110
-
111
-
112
-
113
-
114
-
115
-
116
-
117
-
118
-
119
-
120
-
121
-
122
-
123
-
124
-
125
-
126
-
127
-
128
-
129
-
130
-
131
-
132
-
133
-
134
-
135
-
136
-
137
-
138
-
139
-
140
-
141
-
142
-
143
-
144
-
145
-
146
-
147
-
148
-
149
-
150
-
151
-
152
-
153
-
154
-
155
-
156
-
157
-
158
-
159
-
160
-
161
-
162
-
163
-
164
-
165
-
166
-
167
-
168
 |
 |
77
VQT2M75
A graph with brightness as horizontal axis and number of pixels at that brightness as vertical
axis is displayed. It is possible to determine the exposure of the whole image by looking at
the distribution in the graph.
Adjust the brightness using [IRIS]. (
l
84)
≥
Change the mode to
or
.
≥
Switch to Manual Mode. (
l
82)
≥
Histogram is displayed while adjusting [IRIS] even if [DISPLAY] is set to [OFF].
[HISTOGRAM]
: [RECORD SETUP]
#
[HISTOGRAM]
#
desired setting
≥
It is possible to set from the quick menu in Manual Mode. (
l
45)
[OFF]:
Cancel the setting.
[ALWAYS]:
Constantly display.
[ON ADJUST]:
Display only when [IRIS] is adjusted. (
l
84)
A
Normal
B
Dark
C
Bright
∫
Example of the display