Texas Instruments TI-80 User Manual - Page 133
The value of, 74019608 as guidelines for setting
 |
View all Texas Instruments TI-80 manuals
Add to My Manuals
Save this manual to your list of manuals |
Page 133 highlights
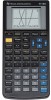
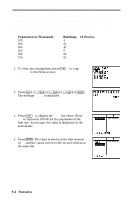
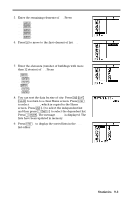
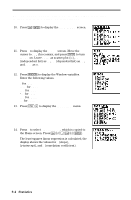
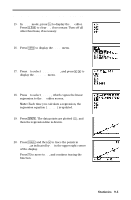
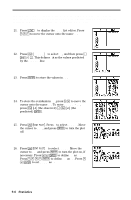
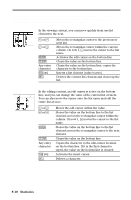
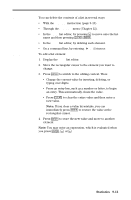
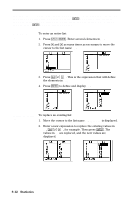
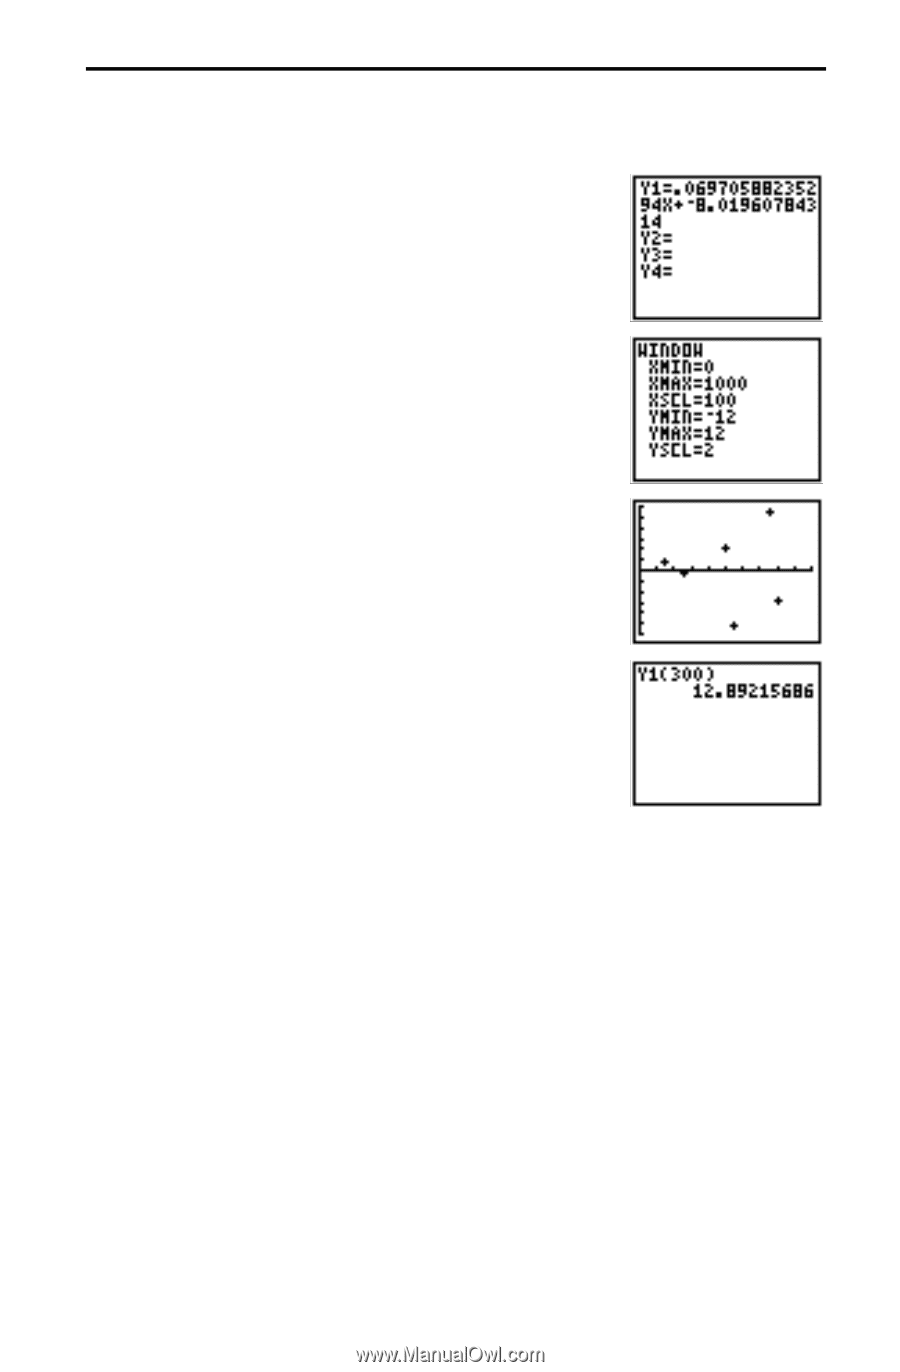
Plot the residuals, and predict how many buildings of 12 or more stories there are in a city with a population of 300 thousand. 27. Press ( 6 ¸ to turn off Y1. 28. Press ), and change the Window variable values to best show the residuals. Use the minimum and maximum values of L4 (M10.31862745 and 10.74019608) as guidelines for setting YMIN and YMAX. 29. Press , to plot the residuals. + marks each residual value. 30. Press y ãQUITä M to return to a clear Home screen. Press y ãY-VARSä 1 to select Y1. Then press £ 300 d Í. The value of Y1 (the linear regression equation) for X=300 (which represents 300 thousand city population) is shown. Remember to round the number mentally to an integer (13) to represent whole buildings. Statistics 9-7
-
 1
1 -
2
-
3
-
4
-
5
-
6
-
7
-
8
-
9
-
10
-
11
-
12
-
13
-
14
-
15
-
16
-
17
-
18
-
19
-
20
-
21
-
22
-
23
-
24
-
25
-
26
-
27
-
28
-
29
-
30
-
31
-
32
-
33
-
34
-
35
-
36
-
37
-
38
-
39
-
40
-
41
-
42
-
43
-
44
-
45
-
46
-
47
-
48
-
49
-
50
-
51
-
52
-
53
-
54
-
55
-
56
-
57
-
58
-
59
-
60
-
61
-
62
-
63
-
64
-
65
-
66
-
67
-
68
-
69
-
70
-
71
-
72
-
73
-
74
-
75
-
76
-
77
-
78
-
79
-
80
-
81
-
82
-
83
-
84
-
85
-
86
-
87
-
88
-
89
-
90
-
91
-
92
-
93
-
94
-
95
-
96
-
97
-
98
-
99
-
100
-
101
-
102
-
103
-
104
-
105
-
106
-
107
-
108
-
109
-
110
-
111
-
112
-
113
-
114
-
115
-
116
-
117
-
118
-
119
-
120
-
121
-
122
-
123
-
124
-
125
-
126
-
127
-
 128
128 -
 129
129 -
 130
130 -
 131
131 -
 132
132 -
 133
133 -
 134
134 -
 135
135 -
 136
136 -
 137
137 -
 138
138 -
139
-
140
-
141
-
142
-
143
-
144
-
145
-
146
-
147
-
148
-
149
-
150
-
151
-
152
-
153
-
154
-
155
-
156
-
157
-
158
-
159
-
160
-
161
-
162
-
163
-
164
-
165
-
166
-
167
-
168
-
169
-
170
-
171
-
172
-
173
-
174
-
175
-
176
-
177
-
178
-
179
-
180
-
181
-
182
-
183
-
184
-
185
-
186
-
187
-
188
-
189
-
190
-
191
-
192
-
193
-
194
-
195
-
196
-
197
-
198
-
199
-
200
-
201
-
202
-
203
-
204
-
205
-
206
-
207
-
208
-
209
-
210
-
211
-
212
-
213
-
214
-
215
-
216
-
217
-
218
-
219
-
220
-
221
-
222
-
223
-
224
-
225
-
226
-
227
-
228
-
229
-
230
-
231
-
232
-
233
-
234
-
235
 |
 |
Statistics
9-7
Plot the residuals, and predict how many buildings of 12 or more stories there
are in a city with a population of 300 thousand.
27.
Press
(
6
¸
to turn off
Y1
.
28.
Press
)
, and change the Window variable
values to best show the residuals. Use the minimum
and maximum values of
L4
(
M
10.31862745 and
10.74019608) as guidelines for setting
YMIN
and
YMAX
.
29.
Press
,
to plot the residuals.
+
marks each residual value.
30.
Press
y
ã
QUIT
ä
M
to return to a clear Home
screen. Press
y
ã
Y-VARS
ä
1
to select
Y1
. Then
press
£
300
d
Í
.
The value of
Y1
(the linear regression equation) for
X
=300 (which represents 300 thousand city
population) is shown. Remember to round the
number mentally to an integer (13) to represent
whole buildings.