Texas Instruments TI36X User Manual - Page 15
Predict, 9, given 4,5, 4,5, 9,9, 2,3., Calculate correlation coefficient, slope, and intercept of,
 |
UPC - 033317029860
View all Texas Instruments TI36X manuals
Add to My Manuals
Save this manual to your list of manuals |
Page 15 highlights
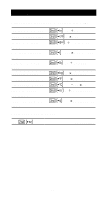
For trend-line analysis, enter 1st data point, and then enter just y values with 4. x is automatically incremented by 1. Linear Regression Example Predict y for x = 9, given (4,5), (4,5), (9,9), (2,3). Calculate correlation coefficient, slope, and intercept of the line, mean of x values, and mean of y values. " ( [ 4 . 5 ( \ 2 4 9 . 9 4 2 . 3 4 9 ( q (predict y for x=9) " œ (correlation coefficient) ( o (slope) ( n (intercept) ( ] (mean of x values) ( c (mean of x values) STAT 0. STAT 0. STAT 2. STAT 3. STAT 4. STAT 9.074766355 STAT 0.998030525 STAT 0.841121495 STAT 1.504672897 STAT 4.75 STAT 5.5 14
-
 1
1 -
2
-
3
-
4
-
5
-
6
-
7
-
8
-
9
-
 10
10 -
 11
11 -
 12
12 -
 13
13 -
 14
14 -
 15
15 -
 16
16 -
 17
17 -
 18
18 -
 19
19 -
 20
20 -
21
-
22
-
23
-
24
-
25
-
26
-
27
-
28
-
29
-
30
 |
 |

14
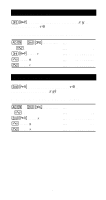
For trend-line analysis, enter 1st data point, and then
enter just
y
values with
4
.
x
is automatically
incremented by 1.
Linear Regression Example
Predict
y
for
x
= 9, given (4,5), (4,5), (9,9), (2,3).
Calculate correlation coefficient, slope, and intercept of
the line, mean of
x
values, and mean of
y
values.
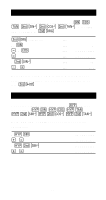
"
³
STAT
0.
(
[
STAT
0.
4
.
5
(
\
2
4
STAT
2.
9
.
9
4
STAT
3.
2
.
3
4
STAT
4.
9
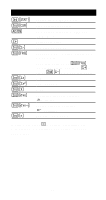
(
q
(predict
y
for
x
=9)
STAT
9.074766355
"
œ
(correlation coefficient)
STAT
0.998030525
(
o
(slope)
STAT
0.841121495
(
n
(intercept)
STAT
1.504672897
(
]
(mean of
x
values)
STAT
4.75
(
c
(mean of
x
values)
STAT
5.5