Texas Instruments TI89TITANIUM User Manual - Page 420
tstep, tplot, ZoomStd, Trace, ncurves, Value, For Differential Equation Graphs
 |
UPC - 033317191833
View all Texas Instruments TI89TITANIUM manuals
Add to My Manuals
Save this manual to your list of manuals |
Page 420 highlights
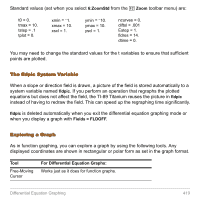
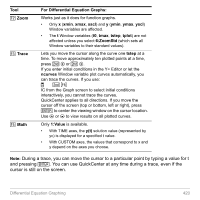
Tool „ Zoom ... Trace ‡ Math For Differential Equation Graphs: Works just as it does for function graphs. • Only x (xmin, xmax, xscl) and y (ymin, ymax, yscl) Window variables are affected. • The t Window variables (t0, tmax, tstep, tplot) are not affected unless you select 6:ZoomStd (which sets all Window variables to their standard values). Lets you move the cursor along the curve one tstep at a time. To move approximately ten plotted points at a time, press 2 B or 2 A. If you enter initial conditions in the Y= Editor or let the ncurves Window variable plot curves automatically, you can trace the curves. If you use: @ 2Š IC from the Graph screen to select initial conditions interactively, you cannot trace the curves. QuickCenter applies to all directions. If you move the cursor off the screen (top or bottom, left or right), press ¸ to center the viewing window on the cursor location. Use C or D to view results on all plotted curves. Only 1:Value is available. • With TIME axes, the y(t) solution value (represented by yc) is displayed for a specified t value. • With CUSTOM axes, the values that correspond to x and y depend on the axes you choose. Note: During a trace, you can move the cursor to a particular point by typing a value for t and pressing ¸. You can use QuickCenter at any time during a trace, even if the cursor is still on the screen. Differential Equation Graphing 420
-
 1
1 -
2
-
3
-
4
-
5
-
6
-
7
-
8
-
9
-
10
-
11
-
12
-
13
-
14
-
15
-
16
-
17
-
18
-
19
-
20
-
21
-
22
-
23
-
24
-
25
-
26
-
27
-
28
-
29
-
30
-
31
-
32
-
33
-
34
-
35
-
36
-
37
-
38
-
39
-
40
-
41
-
42
-
43
-
44
-
45
-
46
-
47
-
48
-
49
-
50
-
51
-
52
-
53
-
54
-
55
-
56
-
57
-
58
-
59
-
60
-
61
-
62
-
63
-
64
-
65
-
66
-
67
-
68
-
69
-
70
-
71
-
72
-
73
-
74
-
75
-
76
-
77
-
78
-
79
-
80
-
81
-
82
-
83
-
84
-
85
-
86
-
87
-
88
-
89
-
90
-
91
-
92
-
93
-
94
-
95
-
96
-
97
-
98
-
99
-
100
-
101
-
102
-
103
-
104
-
105
-
106
-
107
-
108
-
109
-
110
-
111
-
112
-
113
-
114
-
115
-
116
-
117
-
118
-
119
-
120
-
121
-
122
-
123
-
124
-
125
-
126
-
127
-
128
-
129
-
130
-
131
-
132
-
133
-
134
-
135
-
136
-
137
-
138
-
139
-
140
-
141
-
142
-
143
-
144
-
145
-
146
-
147
-
148
-
149
-
150
-
151
-
152
-
153
-
154
-
155
-
156
-
157
-
158
-
159
-
160
-
161
-
162
-
163
-
164
-
165
-
166
-
167
-
168
-
169
-
170
-
171
-
172
-
173
-
174
-
175
-
176
-
177
-
178
-
179
-
180
-
181
-
182
-
183
-
184
-
185
-
186
-
187
-
188
-
189
-
190
-
191
-
192
-
193
-
194
-
195
-
196
-
197
-
198
-
199
-
200
-
201
-
202
-
203
-
204
-
205
-
206
-
207
-
208
-
209
-
210
-
211
-
212
-
213
-
214
-
215
-
216
-
217
-
218
-
219
-
220
-
221
-
222
-
223
-
224
-
225
-
226
-
227
-
228
-
229
-
230
-
231
-
232
-
233
-
234
-
235
-
236
-
237
-
238
-
239
-
240
-
241
-
242
-
243
-
244
-
245
-
246
-
247
-
248
-
249
-
250
-
251
-
252
-
253
-
254
-
255
-
256
-
257
-
258
-
259
-
260
-
261
-
262
-
263
-
264
-
265
-
266
-
267
-
268
-
269
-
270
-
271
-
272
-
273
-
274
-
275
-
276
-
277
-
278
-
279
-
280
-
281
-
282
-
283
-
284
-
285
-
286
-
287
-
288
-
289
-
290
-
291
-
292
-
293
-
294
-
295
-
296
-
297
-
298
-
299
-
300
-
301
-
302
-
303
-
304
-
305
-
306
-
307
-
308
-
309
-
310
-
311
-
312
-
313
-
314
-
315
-
316
-
317
-
318
-
319
-
320
-
321
-
322
-
323
-
324
-
325
-
326
-
327
-
328
-
329
-
330
-
331
-
332
-
333
-
334
-
335
-
336
-
337
-
338
-
339
-
340
-
341
-
342
-
343
-
344
-
345
-
346
-
347
-
348
-
349
-
350
-
351
-
352
-
353
-
354
-
355
-
356
-
357
-
358
-
359
-
360
-
361
-
362
-
363
-
364
-
365
-
366
-
367
-
368
-
369
-
370
-
371
-
372
-
373
-
374
-
375
-
376
-
377
-
378
-
379
-
380
-
381
-
382
-
383
-
384
-
385
-
386
-
387
-
388
-
389
-
390
-
391
-
392
-
393
-
394
-
395
-
396
-
397
-
398
-
399
-
400
-
401
-
402
-
403
-
404
-
405
-
406
-
407
-
408
-
409
-
410
-
411
-
412
-
413
-
414
-
 415
415 -
 416
416 -
 417
417 -
 418
418 -
 419
419 -
 420
420 -
 421
421 -
 422
422 -
 423
423 -
 424
424 -
 425
425 -
426
-
427
-
428
-
429
-
430
-
431
-
432
-
433
-
434
-
435
-
436
-
437
-
438
-
439
-
440
-
441
-
442
-
443
-
444
-
445
-
446
-
447
-
448
-
449
-
450
-
451
-
452
-
453
-
454
-
455
-
456
-
457
-
458
-
459
-
460
-
461
-
462
-
463
-
464
-
465
-
466
-
467
-
468
-
469
-
470
-
471
-
472
-
473
-
474
-
475
-
476
-
477
-
478
-
479
-
480
-
481
-
482
-
483
-
484
-
485
-
486
-
487
-
488
-
489
-
490
-
491
-
492
-
493
-
494
-
495
-
496
-
497
-
498
-
499
-
500
-
501
-
502
-
503
-
504
-
505
-
506
-
507
-
508
-
509
-
510
-
511
-
512
-
513
-
514
-
515
-
516
-
517
-
518
-
519
-
520
-
521
-
522
-
523
-
524
-
525
-
526
-
527
-
528
-
529
-
530
-
531
-
532
-
533
-
534
-
535
-
536
-
537
-
538
-
539
-
540
-
541
-
542
-
543
-
544
-
545
-
546
-
547
-
548
-
549
-
550
-
551
-
552
-
553
-
554
-
555
-
556
-
557
-
558
-
559
-
560
-
561
-
562
-
563
-
564
-
565
-
566
-
567
-
568
-
569
-
570
-
571
-
572
-
573
-
574
-
575
-
576
-
577
-
578
-
579
-
580
-
581
-
582
-
583
-
584
-
585
-
586
-
587
-
588
-
589
-
590
-
591
-
592
-
593
-
594
-
595
-
596
-
597
-
598
-
599
-
600
-
601
-
602
-
603
-
604
-
605
-
606
-
607
-
608
-
609
-
610
-
611
-
612
-
613
-
614
-
615
-
616
-
617
-
618
-
619
-
620
-
621
-
622
-
623
-
624
-
625
-
626
-
627
-
628
-
629
-
630
-
631
-
632
-
633
-
634
-
635
-
636
-
637
-
638
-
639
-
640
-
641
-
642
-
643
-
644
-
645
-
646
-
647
-
648
-
649
-
650
-
651
-
652
-
653
-
654
-
655
-
656
-
657
-
658
-
659
-
660
-
661
-
662
-
663
-
664
-
665
-
666
-
667
-
668
-
669
-
670
-
671
-
672
-
673
-
674
-
675
-
676
-
677
-
678
-
679
-
680
-
681
-
682
-
683
-
684
-
685
-
686
-
687
-
688
-
689
-
690
-
691
-
692
-
693
-
694
-
695
-
696
-
697
-
698
-
699
-
700
-
701
-
702
-
703
-
704
-
705
-
706
-
707
-
708
-
709
-
710
-
711
-
712
-
713
-
714
-
715
-
716
-
717
-
718
-
719
-
720
-
721
-
722
-
723
-
724
-
725
-
726
-
727
-
728
-
729
-
730
-
731
-
732
-
733
-
734
-
735
-
736
-
737
-
738
-
739
-
740
-
741
-
742
-
743
-
744
-
745
-
746
-
747
-
748
-
749
-
750
-
751
-
752
-
753
-
754
-
755
-
756
-
757
-
758
-
759
-
760
-
761
-
762
-
763
-
764
-
765
-
766
-
767
-
768
-
769
-
770
-
771
-
772
-
773
-
774
-
775
-
776
-
777
-
778
-
779
-
780
-
781
-
782
-
783
-
784
-
785
-
786
-
787
-
788
-
789
-
790
-
791
-
792
-
793
-
794
-
795
-
796
-
797
-
798
-
799
-
800
-
801
-
802
-
803
-
804
-
805
-
806
-
807
-
808
-
809
-
810
-
811
-
812
-
813
-
814
-
815
-
816
-
817
-
818
-
819
-
820
-
821
-
822
-
823
-
824
-
825
-
826
-
827
-
828
-
829
-
830
-
831
-
832
-
833
-
834
-
835
-
836
-
837
-
838
-
839
-
840
-
841
-
842
-
843
-
844
-
845
-
846
-
847
-
848
-
849
-
850
-
851
-
852
-
853
-
854
-
855
-
856
-
857
-
858
-
859
-
860
-
861
-
862
-
863
-
864
-
865
-
866
-
867
-
868
-
869
-
870
-
871
-
872
-
873
-
874
-
875
-
876
-
877
-
878
-
879
-
880
-
881
-
882
-
883
-
884
-
885
-
886
-
887
-
888
-
889
-
890
-
891
-
892
-
893
-
894
-
895
-
896
-
897
-
898
-
899
-
900
-
901
-
902
-
903
-
904
-
905
-
906
-
907
-
908
-
909
-
910
-
911
-
912
-
913
-
914
-
915
-
916
-
917
-
918
-
919
-
920
-
921
-
922
-
923
-
924
-
925
-
926
-
927
-
928
-
929
-
930
-
931
-
932
-
933
-
934
-
935
-
936
-
937
-
938
-
939
-
940
-
941
-
942
-
943
-
944
-
945
-
946
-
947
-
948
-
949
-
950
-
951
-
952
-
953
-
954
-
955
-
956
-
957
-
958
-
959
-
960
-
961
-
962
-
963
-
964
-
965
-
966
-
967
-
968
-
969
-
970
-
971
-
972
-
973
-
974
-
975
-
976
-
977
-
978
-
979
-
980
-
981
-
982
-
983
-
984
-
985
-
986
-
987
-
988
-
989
-
990
-
991
-
992
-
993
-
994
-
995
-
996
-
997
-
998
-
999
-
1,000
-
1,001
-
1,002
-
1,003
-
1,004
-
1,005
-
1,006
-
1,007
-
1,008
 |
 |