3Com 3CRWE80096A User Guide - Page 46
Interpreting Test Results, Preferred AP Test Locations, AP Test Location, Throughput, Avg Ping RTT
 |
UPC - 662705441221
View all 3Com 3CRWE80096A manuals
Add to My Manuals
Save this manual to your list of manuals |
Page 46 highlights
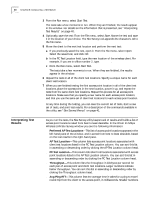
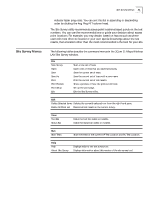
40 CHAPTER 5: CONDUCTING A SITE SURVEY Interpreting Test Results 3 From the Run menu, select Start Test. The tests take a few moments to run. When they are finished, the results appear in the window. For details on the information that is presented, see "Interpreting Test Results" on page 40. 4 Optionally, save the test: From the File menu, select Save. Name the test and save it in the location of your choice. The Site Survey tool appends the characters .ssf to the file name. 5 Move the client to the next test location and perform the next test: a If you previously saved the test, open it: From the File menu, select Open. Select the saved test, and click OK. b In the PC Test Location field, type the new location of the wireless client. For example, if you are in office number 2, type Office2. c From the Run menu, select Start Test. The tests take a few moments to run. When they are finished, the results appear in the window. 6 Repeat the tests in all of the client test locations. Specify a unique name for each client test location. 7 When you are finished testing the first access point location in all of the client test locations, place the access point in the next location, power it up, and repeat the tests from the same client test locations. Repeat this process for all access point locations. Make sure that you specify a new name for each access point location, and that you use the same set of client test locations for each access point location. At any time during the testing, you can save the current set of tests, start a new set of tests, and print test results. For a description of the commands available in the utility, see "Site Survey Menus" on page 41. As you run the tests, the Site Survey utility keeps track of results and builds a list of access point locations rated from best to least desirable. In the 3Com 11 Mbps Wireless LAN Site Survey window you see the following information: s Preferred AP Test Locations-This list of access point locations appears in the left-hand pane of the window, and is sorted from best to least desirable, based on the test results in the right-hand pane. s AP Test Location-This column lists access point locations associated with client test locations listed in the PC Test Location column. You can sort this list in ascending or descending order by clicking the AP Test Location column head. s PC Test Location-This column lists client test locations associated with access point locations listed in the AP Test Location column. You can sort this list in ascending or descending order by clicking the PC Test Location column head. s Throughput-This column lists the throughput in kilobytes per second for each pair of access point and client test locations. Larger numbers indicate better throughput. You can sort this list in ascending or descending order by clicking the Throughput column head. s Avg Ping RTT-This column lists the average time it takes for a ping to travel round trip from the client to the access point, in milliseconds. Smaller numbers
-
 1
1 -
2
-
3
-
4
-
5
-
6
-
7
-
8
-
9
-
10
-
11
-
12
-
13
-
14
-
15
-
16
-
17
-
18
-
19
-
20
-
21
-
22
-
23
-
24
-
25
-
26
-
27
-
28
-
29
-
30
-
31
-
32
-
33
-
34
-
35
-
36
-
37
-
38
-
39
-
40
-
 41
41 -
 42
42 -
 43
43 -
 44
44 -
 45
45 -
 46
46 -
 47
47 -
 48
48 -
 49
49 -
 50
50 -
 51
51 -
52
-
53
-
54
-
55
-
56
-
57
-
58
 |
 |