Canon CanoScan FB 630UI User Guide - Page 37
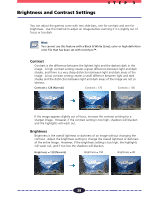
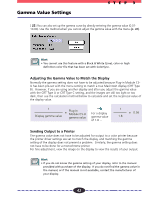
The Relationship Between the Gamma Curve and Image Brightness, Gamma = 1, Gamma < 1
 |
View all Canon CanoScan FB 630UI manuals
Add to My Manuals
Save this manual to your list of manuals |
Page 37 highlights
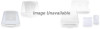
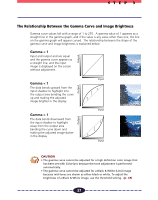
STEP 3 The Relationship Between the Gamma Curve and Image Brightness Gamma curve values fall with a range of 1 to 255. A gamma value of 1 appears as a straight line in the gamma graph, and if the value is any value other than one, the line on the gamma graph will appear curved. The relationship between the shape of the gamma curve and image brightness is explained below. Gamma = 1 Output Input and output and are equal and the gamma curve appears as a straight line, and the input image is displayed on the screen ª without adjustment. Gamma < 1 The data bends upward from the input shadow to highlight into the output area bending the curve up and making the adjusted image brighter in the display. Gamma > 1 The data bends downward from the input shadow to highlight away from the output area bending the curve down and making the adjusted image darker in the display. Output Output Input ª Input ª Input CAUTION • The gamma curve cannot be adjusted for a high definition color image that has been set with ColorSync because the tone adjustment is performed automatically. • The gamma curve cannot be adjusted for a Black & White (Line) image because mid-tones are shown as either black or white. To adjust the brightness of a Black & White image, use the threshold setting. (p. 48) 37
-
 1
1 -
2
-
3
-
4
-
5
-
6
-
7
-
8
-
9
-
10
-
11
-
12
-
13
-
14
-
15
-
16
-
17
-
18
-
19
-
20
-
21
-
22
-
23
-
24
-
25
-
26
-
27
-
28
-
29
-
30
-
31
-
 32
32 -
 33
33 -
 34
34 -
 35
35 -
 36
36 -
 37
37 -
 38
38 -
 39
39 -
 40
40 -
 41
41 -
 42
42 -
43
-
44
-
45
-
46
-
47
-
48
-
49
-
50
-
51
-
52
-
53
-
54
-
55
-
56
-
57
-
58
-
59
-
60
-
61
-
62
 |
 |