Casio FX 9750 User Guide - Page 6
Example - programs
 |
UPC - 079767186043
View all Casio FX 9750 manuals
Add to My Manuals
Save this manual to your list of manuals |
Page 6 highlights
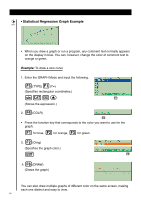
• Statistical Regression Graph Example CFX • When you draw a graph or run a program, any comment text normally appears on the display in blue. You can, however, change the color of comment text to orange or green. Example: To draw a sine curve 1. Enter the GRAPH Mode and input the following. 3(TYPE)1(Y=) (Specifies rectangular coordinates.) svwf (Stores the expression.) 45 4 2. (COLR) 23456 • Press the function key that corresponds to the color you want to use for the graph: 1 2 3 for blue, for orange, for green. 2 3. (Orng) (Specifies the graph color.) J 6 6 4. (DRAW) (Draws the graph) You can also draw multiple graphs of different color on the same screen, making each one distinct and easy to view. iv
-
 1
1 -
 2
2 -
 3
3 -
 4
4 -
 5
5 -
 6
6 -
 7
7 -
 8
8 -
 9
9 -
 10
10 -
 11
11 -
 12
12 -
13
-
14
-
15
-
16
-
17
-
18
-
19
-
20
-
21
-
22
-
23
-
24
-
25
-
26
-
27
-
28
 |
 |
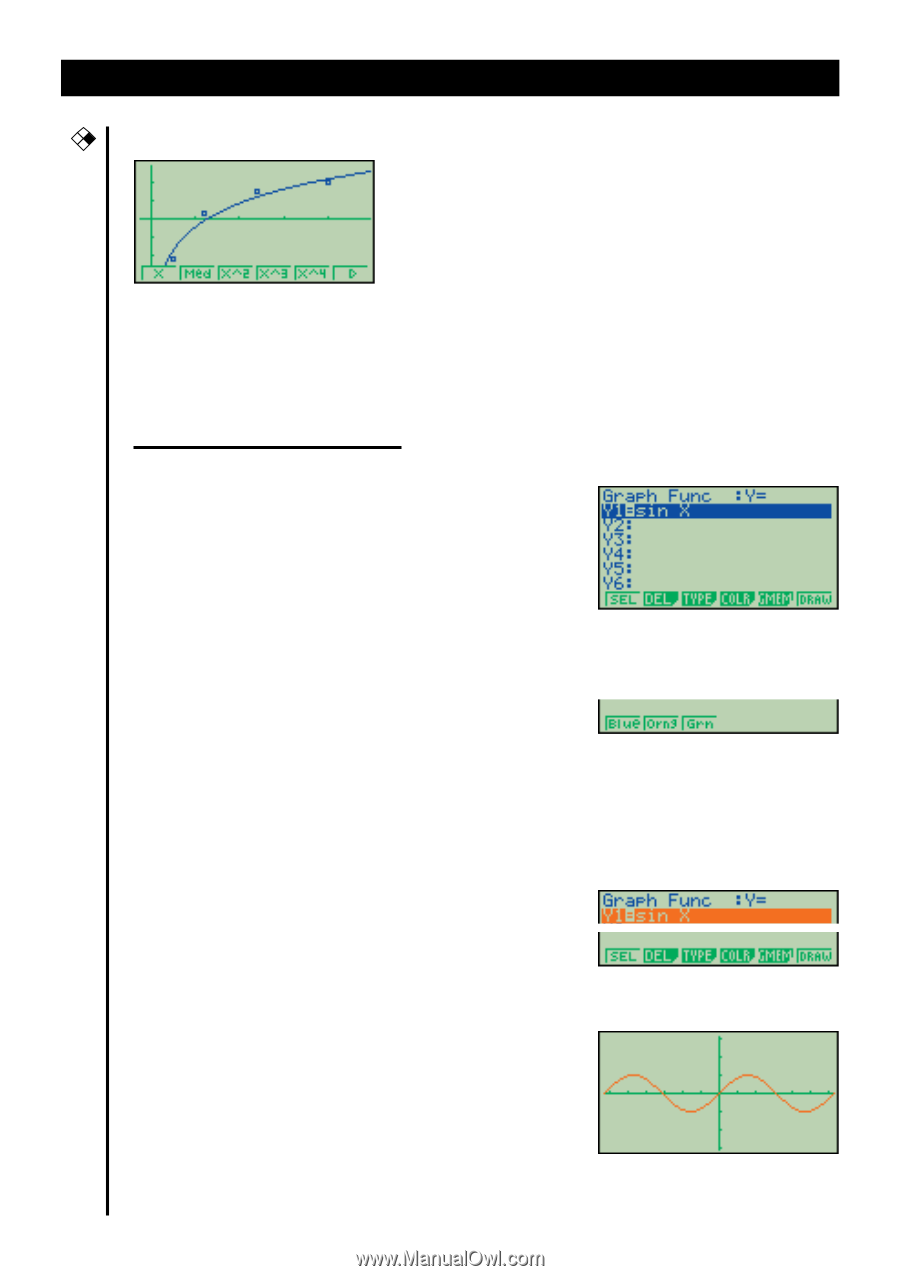
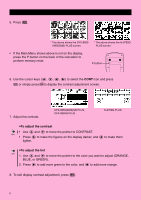
• Statistical Regression Graph Example
•
When you draw a graph or run a program, any comment text normally appears
on the display in blue. You can, however, change the color of comment text to
orange or green.
Example:
To draw a sine curve
1.
Enter the GRAPH Mode and input the following.
3
(TYPE)
1
(Y=)
(Specifies rectangular coordinates.)
svw
f
4
5
(Stores the expression.)
2.
4
(COLR)
2
3456
•
Press the function key that corresponds to the color you want to use for the
graph:
1
for blue,
2
for orange,
3
for green.
3.
2
(Orng)
(Specifies the graph color.)
J
6
4.
6
(DRAW)
(Draws the graph)
You can also draw multiple graphs of different color on the same screen, making
each one distinct and easy to view.
iv
CFX