Dell DVS Simplified Appliance Tower Reference Guide - Page 60
Test: 10GB PVD Standard Run 30 Users
 |
View all Dell DVS Simplified Appliance Tower manuals
Add to My Manuals
Save this manual to your list of manuals |
Page 60 highlights
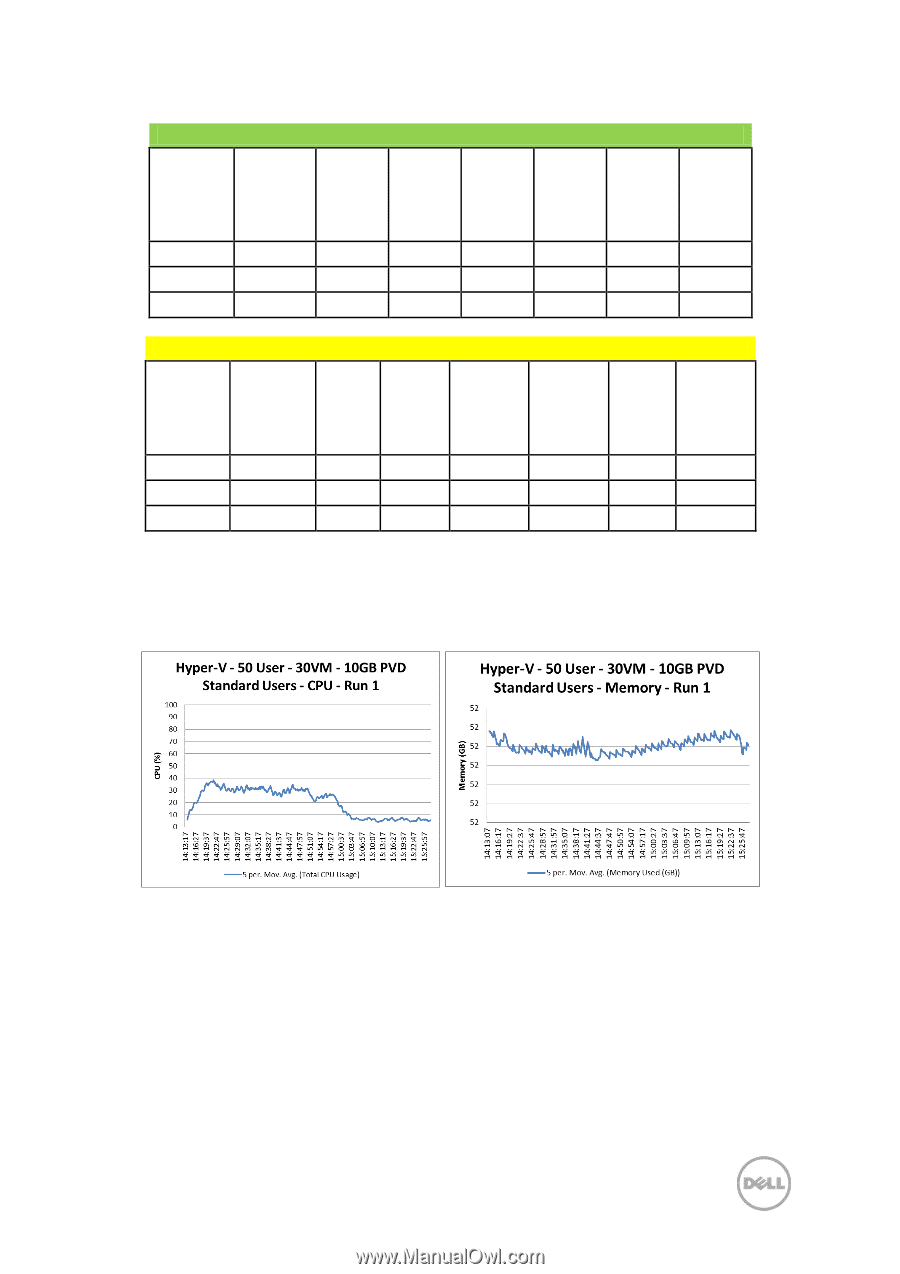
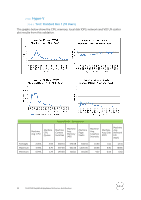
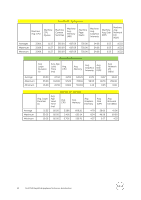
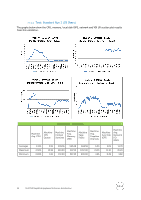
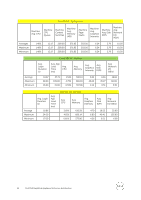
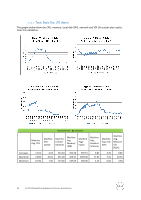
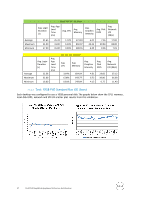
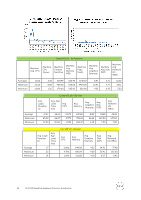
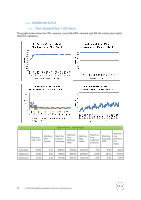
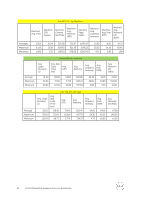
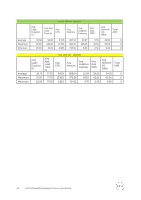
Average Maximum Minimum Good VDI UX - By User Avg. Login Duration (s) Avg. App Load Time (ms) Avg. CPU Avg. Memory Avg. Graphics Intensity Avg. Disk IOPS Avg. Network I/O (KB/s) 21.65 31.00 17.00 25.33 31.00 15.00 1.72% 6.10% 0.59% 573.83 650.97 549.55 6.41 22.21 4.20 7.36 39.94 0.56 17.83 68.00 7.01 Average Maximum Minimum Avg. Login Duration (s) 22.56 32.00 16.00 Avg. App Load Time (ms) Fair VDI UX - By User Avg. CPU Avg. Memory Avg. Graphics Intensity Avg. Disk IOPS Avg. Network I/O (KB/s) 3.64% 6.08% 0.81% 604.04 643.77 549.84 4.51 23.60 6.72 39.80 4.15 0.75 27.12 66.00 11.40 7.3.3.4 Test: 10GB PVD Standard Run (30 Users) Each desktop was configured to use a 10GB personal disk.The graphs below show the CPU, memory, local disk IOPS, network and VDI UX scatter plot results from this validation. 57 Dell DVS Simplified Appliance Reference Architecture
-
 1
1 -
2
-
3
-
4
-
5
-
6
-
7
-
8
-
9
-
10
-
11
-
12
-
13
-
14
-
15
-
16
-
17
-
18
-
19
-
20
-
21
-
22
-
23
-
24
-
25
-
26
-
27
-
28
-
29
-
30
-
31
-
32
-
33
-
34
-
35
-
36
-
37
-
38
-
39
-
40
-
41
-
42
-
43
-
44
-
45
-
46
-
47
-
48
-
49
-
50
-
51
-
52
-
53
-
54
-
 55
55 -
 56
56 -
 57
57 -
 58
58 -
 59
59 -
 60
60 -
 61
61 -
 62
62 -
 63
63 -
 64
64 -
 65
65 -
66
-
67
-
68
-
69
-
70
-
71
-
72
-
73
 |
 |