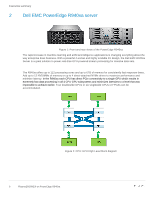
Dell PowerEdge R940xa PlasmaENGINE on EMC - Page 8
Top Right Plasma Engine and Apache Spark Throughput rows/sec
 |
View all Dell PowerEdge R940xa manuals
Add to My Manuals
Save this manual to your list of manuals |
Page 8 highlights
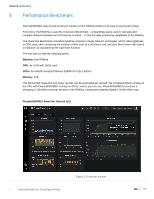
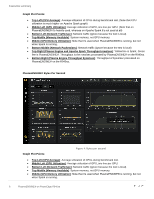
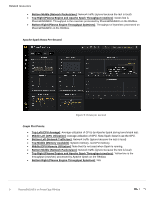
Executive summary Graph Plot Points: • Top Left (CPU Average): Average utilization of CPUs during benchmark test. (Note that CPU utilization is much higher on Apache Spark graph) • Middle Left (GPU Utilization): Average utilization of GPU, one line per GPU. (Note that on PlasmaENGINE® it's heavily used, whereas on Apache Spark it's not used at all) • Bottom Left (Network Traffic/sec): Network traffic (ignore because the test is local) • Top Middle (Memory Available): System memory, not GPU memory. • Middle (GPU Memory Utilization): Note that it's used when PlasmaENGINE® is running, but not when Spark is running. • Bottom Middle (Network Packets/sec): Network traffic (ignore because the test is local) • Top Right (Plasma Engine and Apache Spark Throughput rows/sec): Yellow line is Spark, Green line is PlasmaENGINE®. Throughput is the rows/sec processed by PlasmaENGINE® on the R940xa. • Bottom Right (Plasma Engine Throughput bytes/sec): Throughput of bytes/sec processed on PlasmaENGINE® on the R940xa. PlasmaENGINE® Bytes Per Second Graph Plot Points: Figure 4: Bytes per second • Top Left (CPU Average): Average utilization of CPUs during benchmark test. • Middle Left (GPU Utilization): Average utilization of GPU, one line per GPU. • Bottom Left (Network Traffic/sec): Network traffic (ignore because the test is local) • Top Middle (Memory Available): System memory, not GPU memory. • Middle (GPU Memory Utilization): Note that it's used when PlasmaENGINE® is running, but not when Spark is running. 8 PlasmaENGINE® on PowerEdge R940xa
-
 1
1 -
2
-
 3
3 -
 4
4 -
 5
5 -
 6
6 -
 7
7 -
 8
8 -
 9
9 -
 10
10 -
 11
11
 |
 |
