Fluke 434/PWR Fluke 434/PWR Datasheet - Page 2
Analyze all parameters on display, Fluke Power Log Software - power analyzer
 |
View all Fluke 434/PWR manuals
Add to My Manuals
Save this manual to your list of manuals |
Page 2 highlights
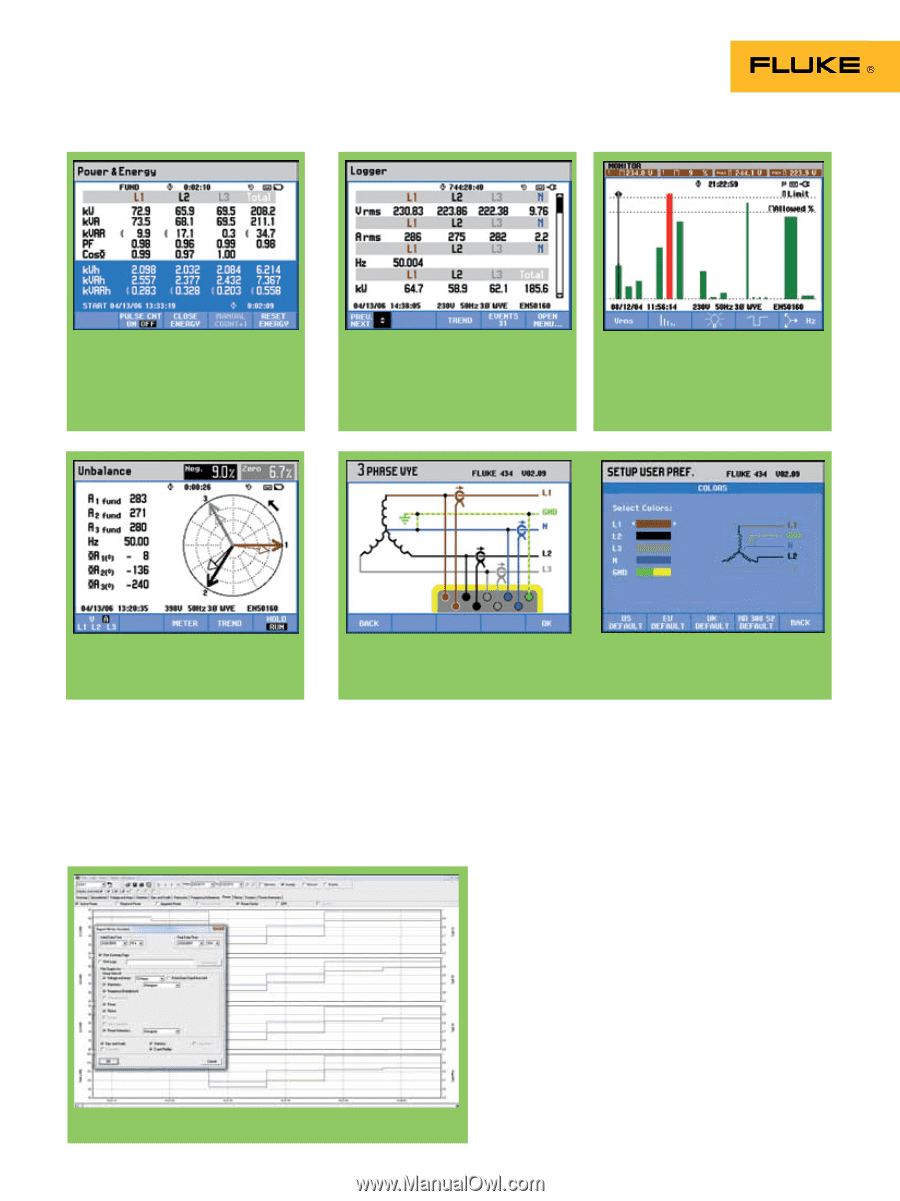
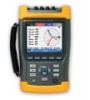
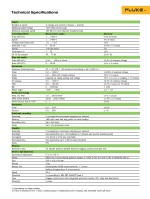
Analyze all parameters on display Measure and record power (W), VA and VARs. The Fluke 434/PWR adds the ability to record energy consumption Logging function allows you to customize measurement selections and provides analysis of user-selectable parameters to find intermittent problems or relate PQ issues to other phenomena/events. The System-Monitor overview screen gives instant insight into whether the voltage, harmonics, frequency, and the number of dips and swells fall outside the set limits. Phasor diagram shows voltage and current unbalance, and helps verify connections. The full color display allows the use of industry-standard color-coding (user selectable) to correlate measurements with actual wiring Fluke Power Log Software Designed to quickly view recorded data, the built-in Power Log software displays all recorded parameters on interactive trends. Generate a professional looking report with the 'PRINT' function or copy and paste images into a report document manually. Customize the report generator to easily create your own formats. Print reports and view graphics with Power Log software.
-
 1
1 -
 2
2 -
 3
3 -
 4
4
 |
 |