Garmin GPSMAP 640 Owner's Manual - Page 58
Viewing Sea Conditions, Understanding Fronts, Understanding City Forecasts
 |
UPC - 753759083557
View all Garmin GPSMAP 640 manuals
Add to My Manuals
Save this manual to your list of manuals |
Page 58 highlights
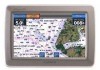
Marine Mode: Using XM WX Weather and Audio Understanding Fronts Fronts show lines indicating the leading edge of an air mass. This feature also shows pressure centers. Pressure centers are represented by a large Red "L" for low-pressure centers, or a large Blue "H" for high-pressure centers. Pressure centers represent an area where pressure is measured to be either the highest or the lowest relative to the surrounding area. Cold Front Warm Front Stationary Front Occluded Front Trough Low-pressure Center-A low-pressure center is an area where the measured pressure is lowest relative to the surrounding area. Moving away from a low-pressure center in any horizontal direction results in increased pressure. Winds flow counterclockwise around Low Pressure Centers in North America. High-pressure Center-A high-pressure center is an area where the measured pressure is highest relative to the surrounding area. Moving away from a high-pressure center in any horizontal direction results in decreased pressure. Winds flow clockwise around high pressure centers in North America. 50 Understanding City Forecasts City forecasts appear as standard weather symbols. The forecast is viewed in 12-hour increments for the next 48 hours. City Forecasts Viewing Sea Conditions Sea Conditions provide surface conditions including winds, wave height, wave period, and wave direction. Sea Conditions GPSMAP 640 Owner's Manual
-
 1
1 -
2
-
3
-
4
-
5
-
6
-
7
-
8
-
9
-
10
-
11
-
12
-
13
-
14
-
15
-
16
-
17
-
18
-
19
-
20
-
21
-
22
-
23
-
24
-
25
-
26
-
27
-
28
-
29
-
30
-
31
-
32
-
33
-
34
-
35
-
36
-
37
-
38
-
39
-
40
-
41
-
42
-
43
-
44
-
45
-
46
-
47
-
48
-
49
-
50
-
51
-
52
-
 53
53 -
 54
54 -
 55
55 -
 56
56 -
 57
57 -
 58
58 -
 59
59 -
 60
60 -
 61
61 -
 62
62 -
 63
63 -
64
-
65
-
66
-
67
-
68
-
69
-
70
-
71
-
72
-
73
-
74
-
75
-
76
-
77
-
78
-
79
-
80
-
81
-
82
-
83
-
84
-
85
-
86
-
87
-
88
-
89
-
90
-
91
-
92
-
93
-
94
-
95
-
96
 |
 |
