Garmin echo 201 Owners Manual - Page 6
Selecting a Full Screen Split Zoom Split Frequency Log Settings, - echo 200 transducer
 |
View all Garmin echo 201 manuals
Add to My Manuals
Save this manual to your list of manuals |
Page 6 highlights
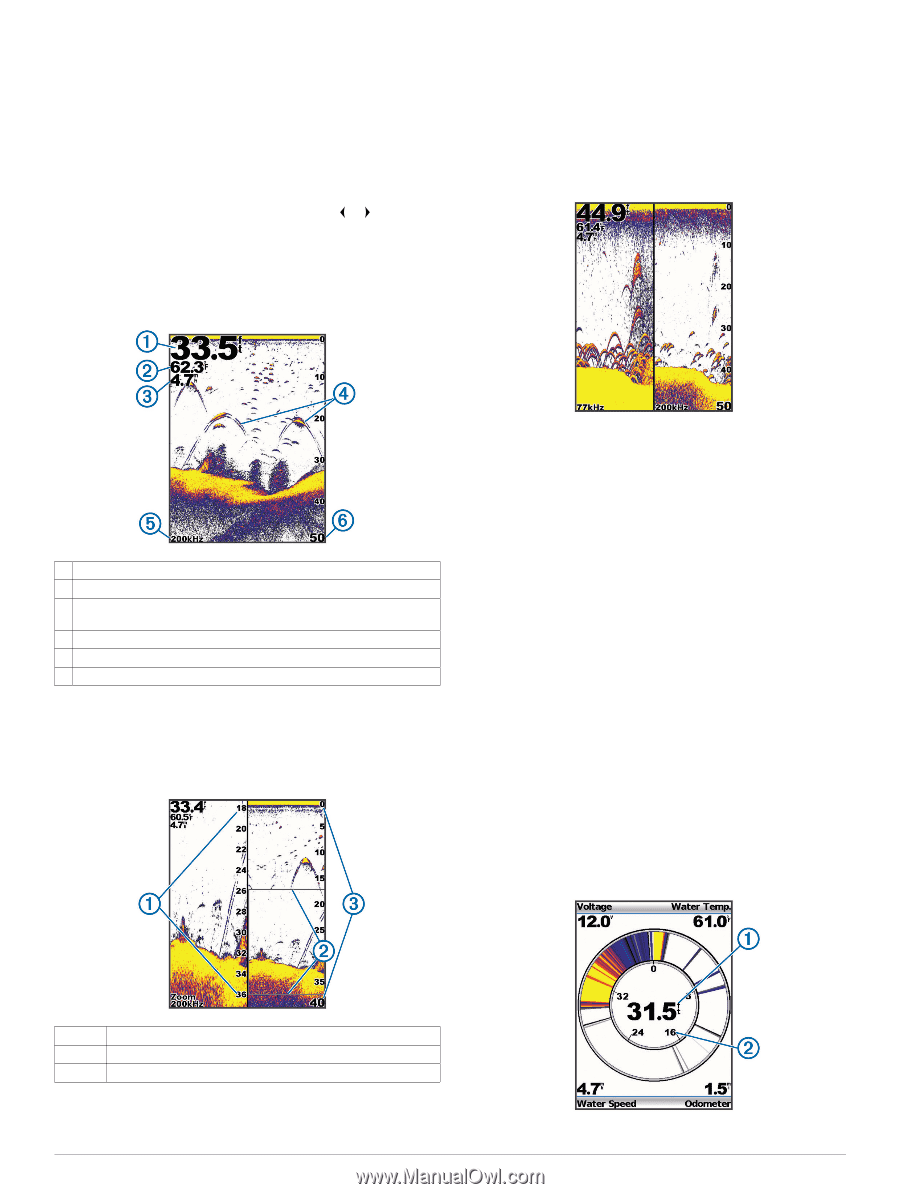
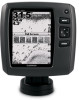
Pages You can view sonar information in different formats using the Pages menu. Selecting a Page 1 Select MENU > Pages. 2 Select a page. TIP: For the echo 200 and 500 series devices, you can access the pages menu quickly by selecting or from any screen. Full Screen Page You can see a full-view graph of sonar readings from a transducer on the full screen page. From the pages menu, select Traditional or DownVü. From the split zoom page, select MENU > Setup > Sonar Setup > Split Size > Large. Split Frequency Page You can view two frequencies from the split frequency page. NOTE: You must have a dual-beam transducer or a dualfrequency transducer to use the split frequency page. Select MENU > Pages > Split Frequency. Bottom depth À Water temperature Á Water speed (When a water-speed capable transducer is  connected) Suspended targets à Transducer frequency Ä Screen depth as the screen scrolls from right to left Å Split Zoom Page On the split zoom page, you can see a full-view graph of sonar readings on the right side of the screen, and a magnified portion of that graph on the left side of the screen. Select MENU > Pages > Split Zoom. Log Page Settings Select MENU > Pages > Log. Depth: Shows a graphic log of depth readings over time. Depth Log Duration: Sets the time scale of the depth log. Increasing the duration shows depth variations over a longer period of time. Decreasing the duration shows more details over a shorter period of time. Scale: sets the scale of the depth range. Increasing the depthrange scale shows more variations in depth. Decreasing the depth-range scale shows more detail in the variation. Auto adjusts the depth range to show all log values within the selected duration. Temperature: Shows a graphic log of water temperature readings over time. Increasing the temperature-range scale shows more variations in temperature. Decreasing the temperature-range scale shows more detail within the variations. Auto adjusts the display to show all log values within the selected duration. Flasher Page The flasher page shows sonar information on a circular depth scale, indicating what is beneath your boat. It is organized as a ring that starts at the top and progresses clockwise. Depth is indicated by the scale inside the ring. Sonar information flashes on the ring when it is received at the depth indicated. The colors indicate different strengths of the sonar return. Select MENU > Pages > Flasher. Zoomed depth scale À Zoom window Á Depth range  Increasing the Width of the Zoom Screen You can increase the width of the magnified portion of the split zoom page. 2 Pages
-
 1
1 -
 2
2 -
 3
3 -
 4
4 -
 5
5 -
 6
6 -
 7
7 -
 8
8 -
 9
9 -
 10
10 -
 11
11 -
 12
12
 |
 |