HP StorageWorks 2/128 Brocade Web Tools Administrator's Guide (53-0000194-01, - Page 190
Creating an SCSI vs. IP Traffic Graph, Performance Graphs, Advanced Monitoring, SCSI vs. IP Traffic
 |
View all HP StorageWorks 2/128 manuals
Add to My Manuals
Save this manual to your list of manuals |
Page 190 highlights
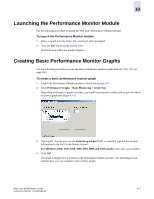
10 Creating an SCSI vs. IP Traffic Graph The SCSI vs. IP Traffic graph displays the SCSI versus IP traffic for selected ports. For SilkWorm 24000 and 48000 directors, the slot and port name is identified in the graph. In a trunk group, the SCSI vs. IP Traffic graph displays only the master port and not the slave ports. To create a SCSI vs. IP Traffic graph 1. Launch the Performance Monitor module as described on page 10-7. 2. Click Performance Graphs > Advanced Monitoring > SCSI vs. IP Traffic. The SCSI vs. IP Traffic Setup dialog box displays. This dialog box is similar to that shown in Figure 10-3 on page 10-9. 3. Double-click the domain icon to expand the slot/port list. For SilkWorm 24000 and 48000 directors, click the + signs to expand the ports under each slot, as shown in Figure 10-3. 4. Click the port you want to monitor in the graph in the Port Selection List. Use Shift-click and Ctrlclick to select multiple ports. 5. Click Add to move the selected ports to the Selected Ports list. 6. Optional: Click ADD ALL Ports to add all of the ports in the Port Selection List to the Selected Ports list. 7. Optional: Click Search to launch the Search Port Selection List dialog box, from which you can search for all E_Ports, all F_Ports, or all port names with a defined string. Select the ports you want to add and click Search in the Search Port Selection List dialog box. 8. Click Apply in the SCSI vs. IP Traffic Setup dialog box. Only the selected ports are displayed in the SCSI vs. IP traffic graph. 10-12 Web Tools Administrator's Guide Publication Number: 53-0000194-01
-
 1
1 -
2
-
3
-
4
-
5
-
6
-
7
-
8
-
9
-
10
-
11
-
12
-
13
-
14
-
15
-
16
-
17
-
18
-
19
-
20
-
21
-
22
-
23
-
24
-
25
-
26
-
27
-
28
-
29
-
30
-
31
-
32
-
33
-
34
-
35
-
36
-
37
-
38
-
39
-
40
-
41
-
42
-
43
-
44
-
45
-
46
-
47
-
48
-
49
-
50
-
51
-
52
-
53
-
54
-
55
-
56
-
57
-
58
-
59
-
60
-
61
-
62
-
63
-
64
-
65
-
66
-
67
-
68
-
69
-
70
-
71
-
72
-
73
-
74
-
75
-
76
-
77
-
78
-
79
-
80
-
81
-
82
-
83
-
84
-
85
-
86
-
87
-
88
-
89
-
90
-
91
-
92
-
93
-
94
-
95
-
96
-
97
-
98
-
99
-
100
-
101
-
102
-
103
-
104
-
105
-
106
-
107
-
108
-
109
-
110
-
111
-
112
-
113
-
114
-
115
-
116
-
117
-
118
-
119
-
120
-
121
-
122
-
123
-
124
-
125
-
126
-
127
-
128
-
129
-
130
-
131
-
132
-
133
-
134
-
135
-
136
-
137
-
138
-
139
-
140
-
141
-
142
-
143
-
144
-
145
-
146
-
147
-
148
-
149
-
150
-
151
-
152
-
153
-
154
-
155
-
156
-
157
-
158
-
159
-
160
-
161
-
162
-
163
-
164
-
165
-
166
-
167
-
168
-
169
-
170
-
171
-
172
-
173
-
174
-
175
-
176
-
177
-
178
-
179
-
180
-
181
-
182
-
183
-
184
-
 185
185 -
 186
186 -
 187
187 -
 188
188 -
 189
189 -
 190
190 -
 191
191 -
 192
192 -
 193
193 -
 194
194 -
 195
195 -
196
-
197
-
198
-
199
-
200
-
201
-
202
-
203
-
204
-
205
-
206
-
207
-
208
-
209
-
210
-
211
-
212
-
213
-
214
-
215
-
216
-
217
-
218
-
219
-
220
-
221
-
222
-
223
-
224
-
225
-
226
-
227
-
228
-
229
-
230
-
231
-
232
-
233
-
234
-
235
-
236
-
237
-
238
-
239
-
240
-
241
-
242
-
243
-
244
-
245
-
246
-
247
-
248
-
249
-
250
-
251
-
252
-
253
-
254
-
255
-
256
-
257
-
258
-
259
-
260
-
261
-
262
-
263
-
264
-
265
-
266
-
267
-
268
-
269
-
270
-
271
-
272
-
273
-
274
-
275
-
276
-
277
-
278
-
279
-
280
-
281
-
282
-
283
-
284
-
285
-
286
-
287
-
288
-
289
-
290
-
291
-
292
-
293
-
294
-
295
-
296
-
297
-
298
-
299
-
300
-
301
-
302
-
303
-
304
-
305
-
306
-
307
-
308
 |
 |
