HP StorageWorks 4/64 Brocade Fabric Watch Administrator's Guide v6.3.0 (53-100 - Page 96
Switch Availability Monitor (SAM) report, Generating a Switch Availability Monitor report
 |
View all HP StorageWorks 4/64 manuals
Add to My Manuals
Save this manual to your list of manuals |
Page 96 highlights
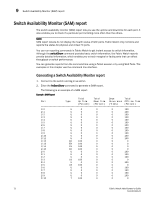
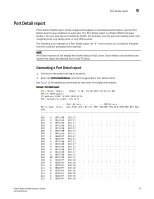
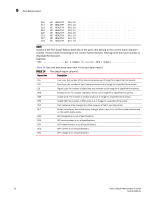
9 Switch Availability Monitor (SAM) report Switch Availability Monitor (SAM) report The switch availability monitor (SAM) report lets you see the uptime and downtime for each port. It also enables you to check if a particular port is failing more often than the others. NOTE SAM report details do not display the health status of GbE ports. Fabric Watch only monitors and reports the status for physical and virtual FC ports. You can run reporting commands in Fabric Watch to get instant access to switch information. Although the switchShow command provides basic switch information, the Fabric Watch reports provide detailed information, which enables you to track marginal or faulty ports that can affect throughput or switch performance. You can generate reports from the command line using a Telnet session or by using Web Tools. The examples in this chapter use the command line interface. Generating a Switch Availability Monitor report 1. Connect to the switch and log in as admin. 2. Enter the fwSamShow command to generate a SAM report. The following is an example of a SAM report. Example : SAM Report Total Total Down Total Port Type Up Time Down Time Occurrence Offline Time (Percent) (Percent) (Times) (Percent) 1/0 U 0 0 0 100 1/1 U 0 0 0 100 1/2 U 0 0 0 100 1/3 U 0 0 0 100 1/4 U 0 0 0 100 1/5 U 0 0 0 100 1/6 U 0 0 0 100 1/7 U 0 0 0 100 1/8 U 0 0 0 100 1/9 U 0 0 0 100 1/10 U 0 0 0 100 1/11 U 0 0 0 100 1/12 EX 100 0 0 0 1/13 EX 100 0 0 0 1/14 EX 100 0 0 0 1/15 EX 100 0 0 0 2/0 U 0 0 0 100 2/1 U 0 0 0 100 2/2 U 0 0 0 100 2/3 LB 100 0 0 0 2/4 U 0 0 0 100 2/5 LB 100 0 0 0 2/6 U 0 0 0 100 2/7 U 0 0 0 100 2/8 U 0 0 0 100 2/9 U 0 0 0 100 2/10 T 100 0 0 0 72 Fabric Watch Administrator's Guide 53-1001342-01
-
 1
1 -
2
-
3
-
4
-
5
-
6
-
7
-
8
-
9
-
10
-
11
-
12
-
13
-
14
-
15
-
16
-
17
-
18
-
19
-
20
-
21
-
22
-
23
-
24
-
25
-
26
-
27
-
28
-
29
-
30
-
31
-
32
-
33
-
34
-
35
-
36
-
37
-
38
-
39
-
40
-
41
-
42
-
43
-
44
-
45
-
46
-
47
-
48
-
49
-
50
-
51
-
52
-
53
-
54
-
55
-
56
-
57
-
58
-
59
-
60
-
61
-
62
-
63
-
64
-
65
-
66
-
67
-
68
-
69
-
70
-
71
-
72
-
73
-
74
-
75
-
76
-
77
-
78
-
79
-
80
-
81
-
82
-
83
-
84
-
85
-
86
-
87
-
88
-
89
-
90
-
 91
91 -
 92
92 -
 93
93 -
 94
94 -
 95
95 -
 96
96 -
 97
97 -
 98
98 -
 99
99 -
 100
100 -
 101
101 -
102
-
103
-
104
-
105
-
106
-
107
-
108
-
109
-
110
-
111
-
112
-
113
-
114
-
115
-
116
-
117
-
118
-
119
-
120
-
121
-
122
-
123
-
124
-
125
-
126
-
127
-
128
-
129
-
130
-
131
-
132
-
133
-
134
-
135
-
136
-
137
-
138
 |
 |