Konica Minolta AccurioPress C6100 AccurioPress C6100/C6085 User Guide Addition - Page 56
Diagnosis] in the AccurioPress C6100/C6085 Additional information booklet.
 |
View all Konica Minolta AccurioPress C6100 manuals
Add to My Manuals
Save this manual to your list of manuals |
Page 56 highlights
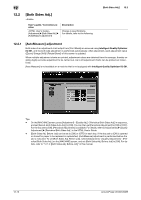
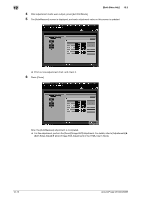
12.1 [Quality Adjustment] 12 6 Select a paper size for the chart. % Load paper (lengthwise (X): 420.0 mm to 487.7 mm and widthwise(Y): 279.4 mm or more) into the tray, then select that tray key. 7 Press Start on the control panel. The chart (below) of the diagnosis item you selected in step 4 is output, and the [Detailed Diagnosis Result] screen is displayed. % For details on the types of output charts, refer to "Overview of [Image Diagnosis]" in "14.2.4 [Image Diagnosis]" in the AccurioPress C6100/C6085 Additional information booklet. % [Auto Correction Finish]: Indicates the item for which diagnosis was completed. Check the output paper. % [Undiagnosed]: Indicates the diagnosis item that is not selected in step 4. % When the image analysis and diagnosis are completed "diagnosis analysis data" and "diagnosis scan image data" are generated. The generated diagnosis results are sent to the service representative as logs if permitted by the setting. For details on log sending, refer to "12.13.6 Error Image Send Permission" in the AccurioPress C6100/C6085 Additional information booklet, or contact your service representative. % If [Output Stored Job after Diagnosis] is set to [ON] in [Image Diagnosis] - [Basic Setting], the AQA Reference chart folder is automatically displayed after the adjustment is completed. AccurioPress C6100/C6085 12-9
-
 1
1 -
2
-
3
-
4
-
5
-
6
-
7
-
8
-
9
-
10
-
11
-
12
-
13
-
14
-
15
-
16
-
17
-
18
-
19
-
20
-
21
-
22
-
23
-
24
-
25
-
26
-
27
-
28
-
29
-
30
-
31
-
32
-
33
-
34
-
35
-
36
-
37
-
38
-
39
-
40
-
41
-
42
-
43
-
44
-
45
-
46
-
47
-
48
-
49
-
50
-
 51
51 -
 52
52 -
 53
53 -
 54
54 -
 55
55 -
 56
56 -
 57
57 -
 58
58 -
 59
59 -
 60
60 -
 61
61 -
62
-
63
-
64
-
65
-
66
-
67
-
68
-
69
-
70
-
71
-
72
-
73
-
74
-
75
-
76
 |
 |
