Konica Minolta bizhub PRESS C6000 IC-601 Color Centro User Guide - Page 142
When you use [Get Tray/Paper Profile information], you cannot set manually [Paper Type], [Paper
 |
View all Konica Minolta bizhub PRESS C6000 manuals
Add to My Manuals
Save this manual to your list of manuals |
Page 142 highlights
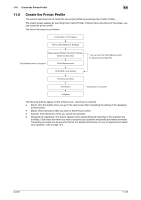
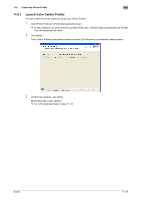
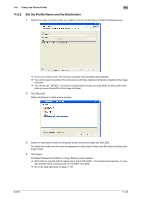
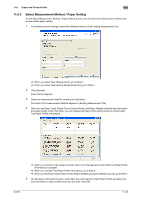
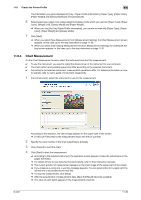
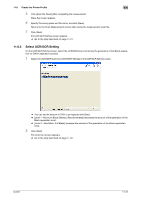
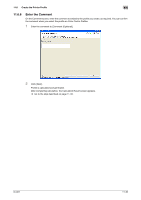
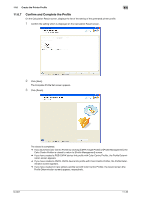
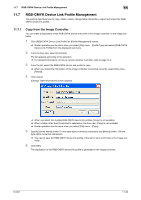
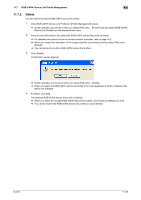
11.6 Create the Printer Profile 11 The information you get is displayed to [Tray / Paper Profile Information]. [Paper Type], [Paper Color], [Paper Weight] and [Glossy Mode] are set automatically. 6 Select paper type, paper color, paper weight and glossy mode which you use from [Paper Type], [Paper Color], [Weight Unit], [Glossy Mode] and [Paper Weight]. % When you use [Get Tray/Paper Profile information], you cannot set manually [Paper Type], [Paper Color], [Paper Weight] and [Glossy Mode]. 7 Click [Next]. % When you select [New Measurement] from [Measurement Setting], the Chart Measurement screen appears. In this case, go to the step described on page 11-30. % When you select [Use Existing Measurement File] from [Measurement Setting], the UCR/GCR Setting screen appears. In this case, go to the step described on page 11-31. 11.6.4 Chart Measurement On the Chart Measurement screen, select the instrument and start the measurement. 0 To use the instrument, you need to install the device driver of the instrument to your computer. 0 The chart pattern and available paper size differ according to the selected instrument. 0 According to the selected instrument, measurement operations differ. For detailed information on how to operate, refer to user's guide of instrument respectively. 1 From [Instrument], select the instrument to use for the measurement. According to the selection, the chart image appears on the upper-right of the screen. % [i11Sis (UV Filer)] returns the measurement result with the UV cut filter. 2 Specify the copy number of the chart outputting to [Copies]. 3 Click [Output] to print the chart. 4 Click [Start] to start the measurement. % According to the selected instrument, the operation screen appears. Follow the instructions on the pages that follow. % For details of how to use instruments (colorimeters), refer to their instruction manuals. % The current position of measurement appears on the chart image of the upper-right of the screen. % If you measure a wrong line, a warning message appears. You can select either to try again with the correct line or to proceed to the next line. % To stop the measurement, click [Stop]. % After the acquirement of measurement data, [Save the Result] becomes available. % The value of each patch appears in the measurement result list. IC-601 11-30
-
 1
1 -
2
-
3
-
4
-
5
-
6
-
7
-
8
-
9
-
10
-
11
-
12
-
13
-
14
-
15
-
16
-
17
-
18
-
19
-
20
-
21
-
22
-
23
-
24
-
25
-
26
-
27
-
28
-
29
-
30
-
31
-
32
-
33
-
34
-
35
-
36
-
37
-
38
-
39
-
40
-
41
-
42
-
43
-
44
-
45
-
46
-
47
-
48
-
49
-
50
-
51
-
52
-
53
-
54
-
55
-
56
-
57
-
58
-
59
-
60
-
61
-
62
-
63
-
64
-
65
-
66
-
67
-
68
-
69
-
70
-
71
-
72
-
73
-
74
-
75
-
76
-
77
-
78
-
79
-
80
-
81
-
82
-
83
-
84
-
85
-
86
-
87
-
88
-
89
-
90
-
91
-
92
-
93
-
94
-
95
-
96
-
97
-
98
-
99
-
100
-
101
-
102
-
103
-
104
-
105
-
106
-
107
-
108
-
109
-
110
-
111
-
112
-
113
-
114
-
115
-
116
-
117
-
118
-
119
-
120
-
121
-
122
-
123
-
124
-
125
-
126
-
127
-
128
-
129
-
130
-
131
-
132
-
133
-
134
-
135
-
136
-
 137
137 -
 138
138 -
 139
139 -
 140
140 -
 141
141 -
 142
142 -
 143
143 -
 144
144 -
 145
145 -
 146
146 -
 147
147 -
148
-
149
-
150
-
151
-
152
-
153
-
154
-
155
-
156
-
157
-
158
-
159
-
160
-
161
-
162
-
163
-
164
-
165
-
166
-
167
-
168
-
169
-
170
-
171
-
172
-
173
-
174
-
175
-
176
-
177
-
178
-
179
-
180
-
181
-
182
-
183
-
184
-
185
-
186
-
187
-
188
-
189
-
190
-
191
-
192
-
193
-
194
-
195
-
196
-
197
-
198
-
199
-
200
-
201
-
202
-
203
-
204
-
205
-
206
-
207
-
208
-
209
-
210
-
211
-
212
-
213
-
214
-
215
-
216
-
217
-
218
-
219
-
220
-
221
-
222
-
223
-
224
-
225
-
226
-
227
-
228
-
229
-
230
-
231
-
232
-
233
-
234
-
235
-
236
-
237
-
238
-
239
-
240
-
241
-
242
-
243
-
244
-
245
-
246
-
247
-
248
-
249
-
250
-
251
-
252
-
253
-
254
-
255
-
256
-
257
-
258
-
259
-
260
-
261
-
262
-
263
-
264
-
265
-
266
-
267
-
268
-
269
-
270
-
271
-
272
-
273
-
274
-
275
-
276
-
277
-
278
-
279
 |
 |