McAfee M-1250 Deployment Guide - Page 12
Viewing and working with data generated by Network Security Platform - review
 |
View all McAfee M-1250 manuals
Add to My Manuals
Save this manual to your list of manuals |
Page 12 highlights
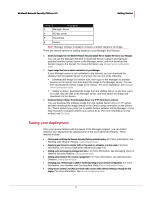
McAfee® Network Security Platform 6.0 Getting Started Viewing and working with data generated by Network Security Platform Once you've completed the steps in the previous sections, you're up and running. While actively monitoring network traffic, your Sensor will generate alerts for traffic that is in violation of the set security policy. Network Security Platform displays a summary view of the count of alerts in the Manager Home page, organized by severity (High, Medium, Low, and Informational). Network Security Platform provides two tools for examining and viewing the alerts: The Threat Analyzer enables you to drill down to the details of an alert such as what triggered the alert, when, what Sensor detected it, the source IP address of the attack that triggered the alert, the destination IP address of the attack, and so on. You use the Threat Analyzer to perform forensic analysis on the alert to help you tune the Network Security Platform system, provide better responses to attacks, and otherwise shore up your defenses. The Reports Main page provides you detailed reports based on your alerts, and reports on your Network Security Platform configuration. You can use these reports to communicate incidents to other members of your team and to your management. Note: For more information on these tools, see Manager Server Configuration Guide and Reports Guide. Configuring your deployment using the Manager Once you're up and running and reviewing the data generated by the system, you can further configure and maintain your system. For example, you can do the following: Apply security policies to each interface of your multi-port Sensor (instead of applying one policy to all interfaces, as when you chose the default policy in Establish Sensor-to-Manager communication (on page 2)). You can ensure all of your interfaces use policies specifically for the areas of your network they are monitoring. For example, you can apply the Web Server policy to one interface, a Mail Server policy to another, the Internal Segment policy to another, and so on. For more information on the provided policies, see Network Security Platform policies, Getting Started Guide. Configure responses to alerts. Developing a system of actions, alerts, and logs based on impact severity is recommended for effective network security. For example, you can configure Network Security Platform to send a page or an email notification, execute a script, disconnect a TCP connection, send an "ICMP Host Not Reachable" message to the attack source for ICMP transmissions, or send address-blocking for a host. For more information on response actions, see Response management, Getting Started Guide. For more information on configuring pager, email, or script notification, or configuring an IPS quarantine response, see Administrative Domain Configuration Guide and Device Configuration Guide. Filter alerts. An attack filter limits the number of alerts generated by the system by excluding certain Source and Destination IP address parameters. If these address parameters are detected in a packet, the packet is not analyzed further (and is automatically forwarded when in In-line Mode). For more information on attack filters, see Administrative Domain Configuration Guide. 5
-
 1
1 -
2
-
3
-
4
-
5
-
6
-
 7
7 -
 8
8 -
 9
9 -
 10
10 -
 11
11 -
 12
12 -
 13
13 -
 14
14 -
 15
15 -
 16
16 -
 17
17 -
18
-
19
-
20
-
21
-
22
-
23
-
24
-
25
-
26
-
27
-
28
-
29
-
30
-
31
-
32
-
33
-
34
-
35
-
36
 |
 |
