Netgear GS724TS GS7xxTS User Manual - Page 198
Log Filter, Monitoring >, Logs > Log Filter, RAM Logs - problems
 |
UPC - 606449049442
View all Netgear GS724TS manuals
Add to My Manuals
Save this manual to your list of manuals |
Page 198 highlights
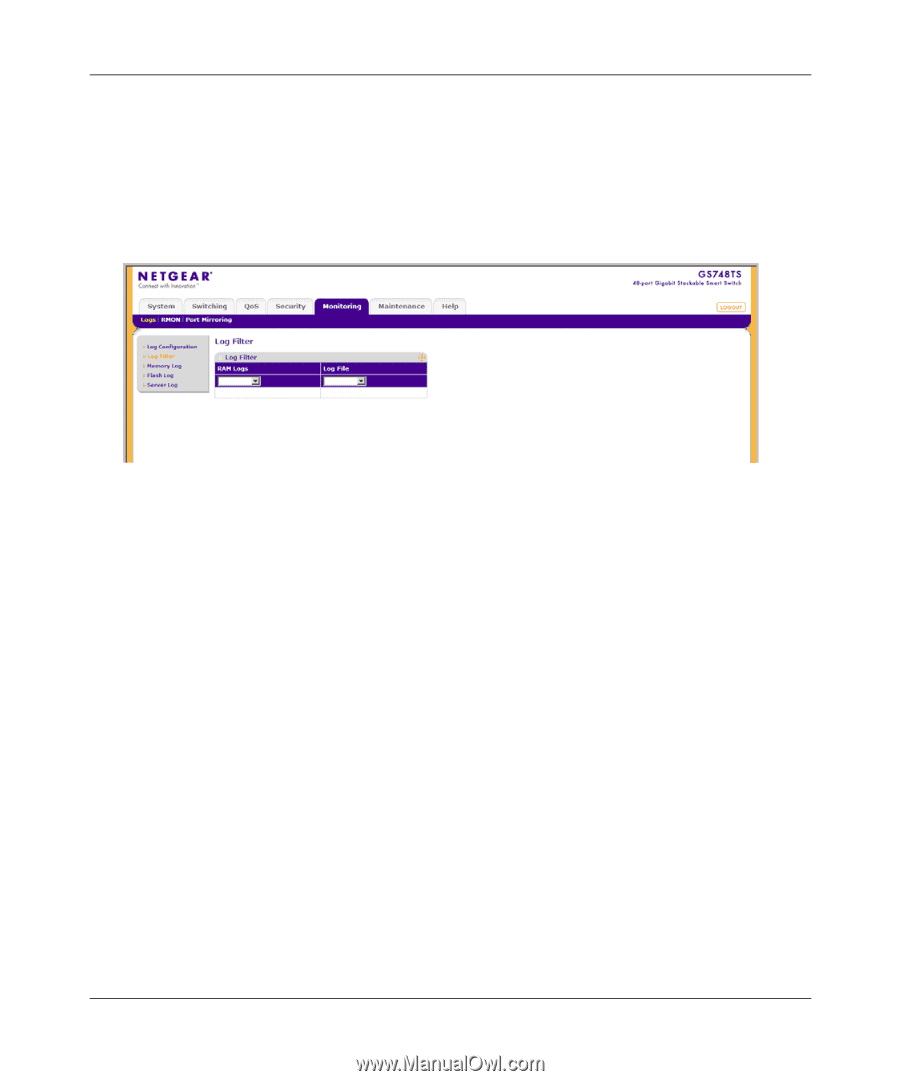
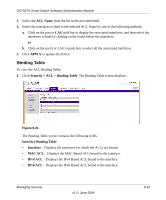
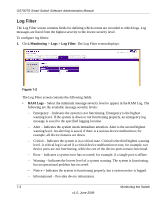
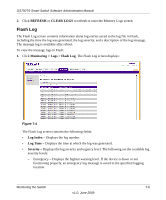
GS700TS Smart Switch Software Administration Manual Log Filter The Log Filter screen contains fields for defining which events are recorded to which logs. Log messages are listed from the highest severity to the lowest severity level. To configure log filters: 1. Click Monitoring > Logs > Log Filter. The Log Filter screen displays: Figure 7-2 The Log Filter screen contains the following fields: • RAM Logs - Select the minimum message severity level to appear in the RAM Log. The following are the available message severity levels: - Emergency - Indicates the system is not functioning. Emergency is the highest warning level. If the system is down or not functioning properly, an emergency log message is saved to the specified logging location. - Alert - Indicates the system needs immediate attention. Alert is the second highest warning level. An alert log is saved, if there is a serious device malfunction; for example, all device features are down. - Critical - Indicates the system is in a critical state. Critical is the third highest warning level. A critical log is saved if a critical device malfunction occurs; for example, two device ports are not functioning, while the rest of the device ports remain functional. - Error - Indicates a system error has occurred; for example, if a single port is offline. - Warning - Indicates the lowest level of a system warning. The system is functioning, but an operational problem has occurred. - Notice - Indicates the system is functioning properly, but a system notice is logged. - Informational - Provides device information. 7-3 Monitoring the Switch v1.0, June 2009
-
 1
1 -
2
-
3
-
4
-
5
-
6
-
7
-
8
-
9
-
10
-
11
-
12
-
13
-
14
-
15
-
16
-
17
-
18
-
19
-
20
-
21
-
22
-
23
-
24
-
25
-
26
-
27
-
28
-
29
-
30
-
31
-
32
-
33
-
34
-
35
-
36
-
37
-
38
-
39
-
40
-
41
-
42
-
43
-
44
-
45
-
46
-
47
-
48
-
49
-
50
-
51
-
52
-
53
-
54
-
55
-
56
-
57
-
58
-
59
-
60
-
61
-
62
-
63
-
64
-
65
-
66
-
67
-
68
-
69
-
70
-
71
-
72
-
73
-
74
-
75
-
76
-
77
-
78
-
79
-
80
-
81
-
82
-
83
-
84
-
85
-
86
-
87
-
88
-
89
-
90
-
91
-
92
-
93
-
94
-
95
-
96
-
97
-
98
-
99
-
100
-
101
-
102
-
103
-
104
-
105
-
106
-
107
-
108
-
109
-
110
-
111
-
112
-
113
-
114
-
115
-
116
-
117
-
118
-
119
-
120
-
121
-
122
-
123
-
124
-
125
-
126
-
127
-
128
-
129
-
130
-
131
-
132
-
133
-
134
-
135
-
136
-
137
-
138
-
139
-
140
-
141
-
142
-
143
-
144
-
145
-
146
-
147
-
148
-
149
-
150
-
151
-
152
-
153
-
154
-
155
-
156
-
157
-
158
-
159
-
160
-
161
-
162
-
163
-
164
-
165
-
166
-
167
-
168
-
169
-
170
-
171
-
172
-
173
-
174
-
175
-
176
-
177
-
178
-
179
-
180
-
181
-
182
-
183
-
184
-
185
-
186
-
187
-
188
-
189
-
190
-
191
-
192
-
 193
193 -
 194
194 -
 195
195 -
 196
196 -
 197
197 -
 198
198 -
 199
199 -
 200
200 -
 201
201 -
 202
202 -
 203
203 -
204
-
205
-
206
-
207
-
208
-
209
-
210
-
211
-
212
-
213
-
214
-
215
-
216
-
217
-
218
-
219
-
220
-
221
-
222
-
223
-
224
-
225
-
226
-
227
-
228
-
229
-
230
-
231
-
232
 |
 |