Texas Instruments TI-34 User Manual - Page 38
linear relationship. The TI-34 MultiView™ calculator uses - multiview 34 calculator
 |
UPC - 331719036203
View all Texas Instruments TI-34 manuals
Add to My Manuals
Save this manual to your list of manuals |
Page 38 highlights
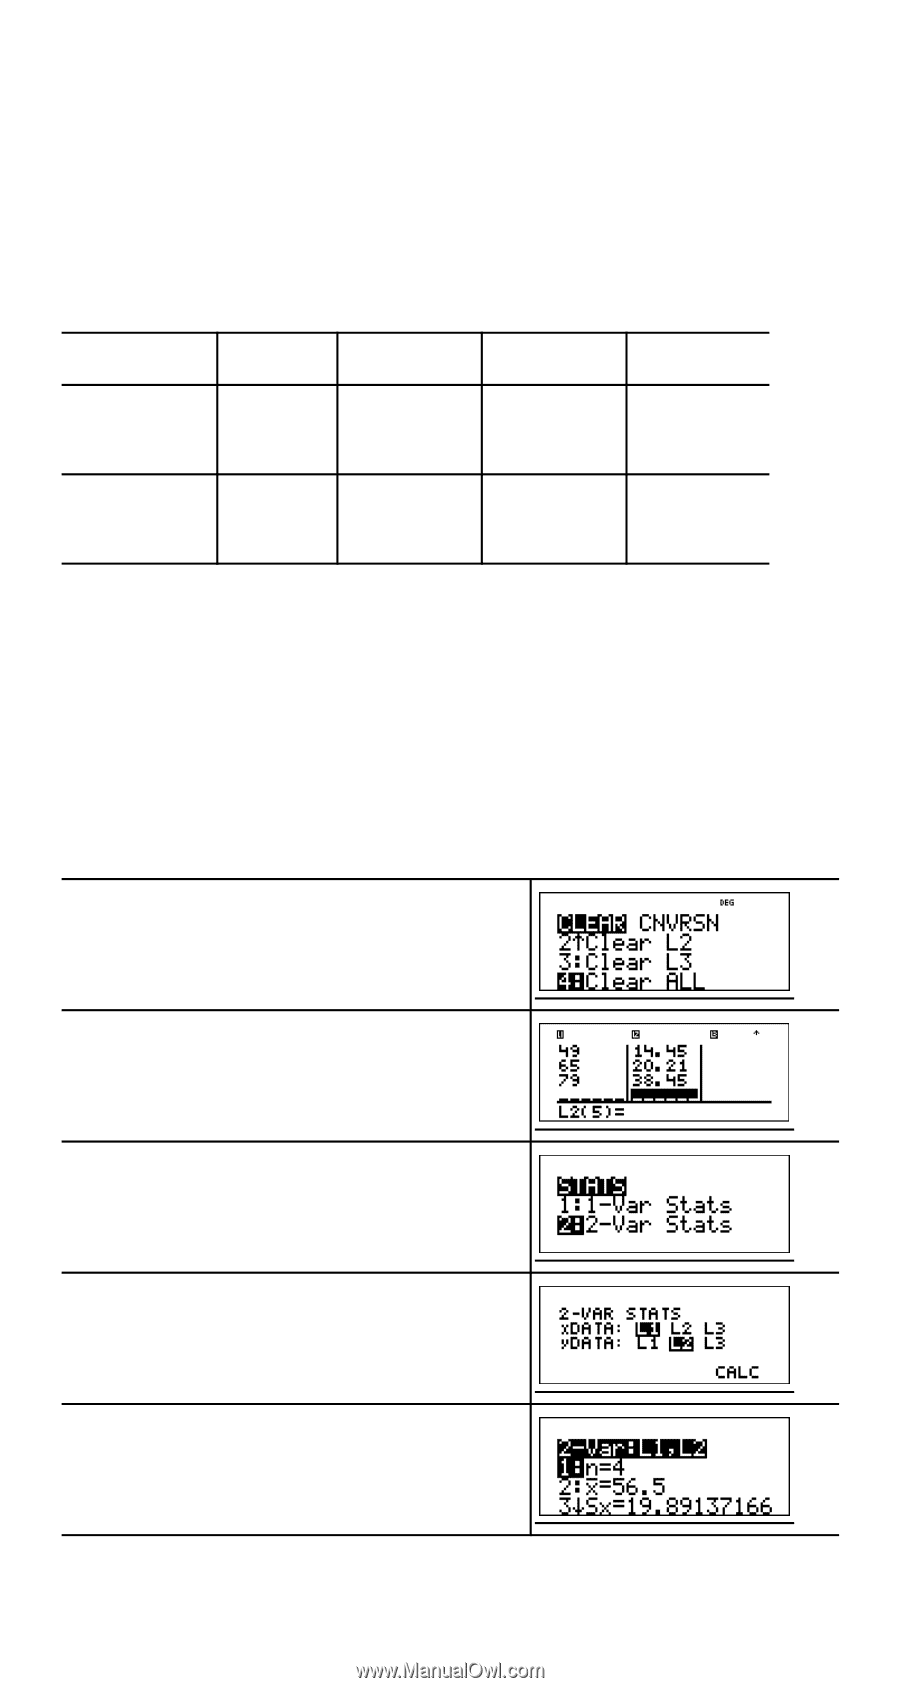
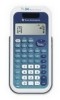
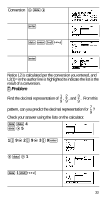
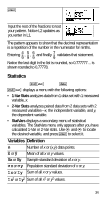
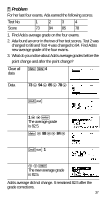
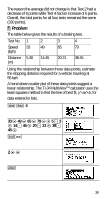
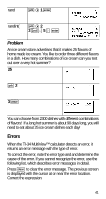
The reason the average did not change is that Test 2 had a decrease of 6 points while Test 4 had an increase of 6 points. Overall, the total points for all four tests remained the same (330 points). ³ Problem The table below gives the results of a braking test. Test No. 1 Speed 33 (kph) Distance 5.30 (m) 2 49 14.45 3 65 20.21 4 79 38.45 Using the relationship between these data points, estimate the stopping distance required for a vehicle traveling at 55 kph. A hand-drawn scatter plot of these data points suggest a linear relationship. The TI-34 MultiView™ calculator uses the least squares method to find the line of best fit, y'=ax'+b, for data entered in lists. v v 4 33 $ 49 $ 65 $ 79 $ " 5 8 3 $ 14 8 45 $ 20 8 21 $ 38 8 45 $ %t 2 $ $ < 38
-
 1
1 -
2
-
3
-
4
-
5
-
6
-
7
-
8
-
9
-
10
-
11
-
12
-
13
-
14
-
15
-
16
-
17
-
18
-
19
-
20
-
21
-
22
-
23
-
24
-
25
-
26
-
27
-
28
-
29
-
30
-
31
-
32
-
 33
33 -
 34
34 -
 35
35 -
 36
36 -
 37
37 -
 38
38 -
 39
39 -
 40
40 -
 41
41 -
 42
42 -
 43
43 -
44
-
45
 |
 |