Adobe 65009626 User Guide - Page 10
Digital audio fundamentals, Understanding sound, Sound waves, Waveform measurements - air
 |
UPC - 883919156019
View all Adobe 65009626 manuals
Add to My Manuals
Save this manual to your list of manuals |
Page 10 highlights
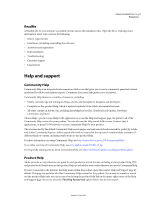
6 Chapter 2: Digital audio fundamentals An understanding of key audio concepts helps you get the most out of Adobe Soundbooth. Understanding sound Sound waves Sound starts with vibrations in the air, like those produced by guitar strings, vocal cords, or speaker cones. These vibrations push nearby air molecules together, raising the air pressure slightly. The air molecules under pressure then push on the air molecules surrounding them, which push on the next set of molecules, and so on. As high-pressure areas move through the air, they leave low-pressure areas behind them. When these waves of pressure changes reach us, they vibrate the receptors in our ears, and we hear the vibrations as sound. When you see a visual waveform that represents audio, it reflects these waves of air pressure. The zero line in the waveform is the pressure of air at rest. When the line swings up to a peak, it represents higher pressure; when the line swings down to a trough, it represents lower pressure. C A 0 B A sound wave represented as a visual waveform A. Zero line B. Low-pressure area C. High-pressure area Waveform measurements Several measurements describe sound waveforms: Amplitude Reflects the change in pressure from the peak of the waveform to the trough. High-amplitude waveforms are loud; low-amplitude waveforms are quiet. Cycle Describes a single, repeated sequence of pressure changes, from zero pressure, to high pressure, to low pressure, and back to zero. Frequency Measured in hertz (Hz), describes the number of cycles per second. (For example, a 1000-Hz waveform has 1000 cycles per second.) The higher the frequency, the higher the musical pitch. Phase Measured in 360 degrees, indicates the position of a waveform in a cycle. Zero degrees is the start point, followed by 90º at high pressure, 180º at the halfway point, 270º at low pressure, and 360º at the end point. Wavelength Measured in units such as inches or centimeters, is the distance between two points with the same degree of phase. As frequency increases, wavelength decreases. Updated 15 July 2009
-
 1
1 -
2
-
3
-
4
-
 5
5 -
 6
6 -
 7
7 -
 8
8 -
 9
9 -
 10
10 -
 11
11 -
 12
12 -
 13
13 -
 14
14 -
 15
15 -
16
-
17
-
18
-
19
-
20
-
21
-
22
-
23
-
24
-
25
-
26
-
27
-
28
-
29
-
30
-
31
-
32
-
33
-
34
-
35
-
36
-
37
-
38
-
39
-
40
-
41
-
42
-
43
-
44
-
45
-
46
-
47
-
48
-
49
-
50
-
51
-
52
-
53
-
54
-
55
-
56
-
57
-
58
-
59
-
60
-
61
-
62
-
63
-
64
-
65
-
66
-
67
-
68
-
69
-
70
-
71
-
72
-
73
-
74
-
75
-
76
-
77
-
78
-
79
-
80
-
81
-
82
-
83
-
84
-
85
-
86
-
87
-
88
-
89
-
90
-
91
-
92
-
93
-
94
-
95
-
96
-
97
-
98
-
99
-
100
-
101
-
102
 |
 |
