D-Link DES-3526DC Product Manual - Page 172
Errors, Received (RX)
 |
View all D-Link DES-3526DC manuals
Add to My Manuals
Save this manual to your list of manuals |
Page 172 highlights
Errors xStack DES-3500 Series Layer 2 Stackable Fast Ethernet Managed Switch User Manual The Web Manager allows port error statistics compiled by the Switch's management agent to be viewed as either a line graph or a table. Four windows are offered. Received (RX) Click the Received (RX) link in the Error folder of the Monitoring menu to view the following graph of error packets received on the Switch. Figure 8- 9. Rx Error Analysis window (line graph) To view the Received Error Packets Table, click the link View Table, which will show the following table: The following fields can be set: Figure 8- 10. Rx Error Analysis window (table) 158
-
 1
1 -
2
-
3
-
4
-
5
-
6
-
7
-
8
-
9
-
10
-
11
-
12
-
13
-
14
-
15
-
16
-
17
-
18
-
19
-
20
-
21
-
22
-
23
-
24
-
25
-
26
-
27
-
28
-
29
-
30
-
31
-
32
-
33
-
34
-
35
-
36
-
37
-
38
-
39
-
40
-
41
-
42
-
43
-
44
-
45
-
46
-
47
-
48
-
49
-
50
-
51
-
52
-
53
-
54
-
55
-
56
-
57
-
58
-
59
-
60
-
61
-
62
-
63
-
64
-
65
-
66
-
67
-
68
-
69
-
70
-
71
-
72
-
73
-
74
-
75
-
76
-
77
-
78
-
79
-
80
-
81
-
82
-
83
-
84
-
85
-
86
-
87
-
88
-
89
-
90
-
91
-
92
-
93
-
94
-
95
-
96
-
97
-
98
-
99
-
100
-
101
-
102
-
103
-
104
-
105
-
106
-
107
-
108
-
109
-
110
-
111
-
112
-
113
-
114
-
115
-
116
-
117
-
118
-
119
-
120
-
121
-
122
-
123
-
124
-
125
-
126
-
127
-
128
-
129
-
130
-
131
-
132
-
133
-
134
-
135
-
136
-
137
-
138
-
139
-
140
-
141
-
142
-
143
-
144
-
145
-
146
-
147
-
148
-
149
-
150
-
151
-
152
-
153
-
154
-
155
-
156
-
157
-
158
-
159
-
160
-
161
-
162
-
163
-
164
-
165
-
166
-
 167
167 -
 168
168 -
 169
169 -
 170
170 -
 171
171 -
 172
172 -
 173
173 -
 174
174 -
 175
175 -
 176
176 -
 177
177 -
178
-
179
-
180
-
181
-
182
-
183
-
184
-
185
-
186
-
187
-
188
-
189
-
190
-
191
-
192
-
193
-
194
-
195
-
196
-
197
-
198
-
199
-
200
-
201
-
202
-
203
-
204
-
205
-
206
-
207
-
208
-
209
-
210
-
211
-
212
-
213
-
214
-
215
-
216
-
217
-
218
-
219
-
220
-
221
-
222
-
223
-
224
-
225
-
226
-
227
-
228
-
229
-
230
-
231
-
232
-
233
-
234
-
235
-
236
-
237
-
238
-
239
-
240
-
241
-
242
-
243
-
244
-
245
-
246
-
247
-
248
-
249
-
250
-
251
-
252
-
253
-
254
-
255
-
256
-
257
-
258
-
259
-
260
 |
 |
xStack DES-3500 Series Layer 2 Stackable Fast Ethernet Managed Switch User Manual
158
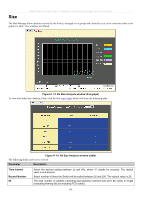
Errors
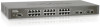
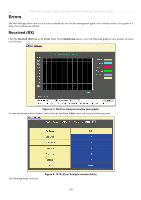
The Web Manager allows port error statistics compiled by the Switch's management agent to be viewed as either a line graph or a
table. Four windows are offered.
Received (RX)
Click the
Received (RX)
link in the
Error
folder of the
Monitoring
menu to view the following graph of error packets received
on the Switch.
Figure 8- 9. Rx Error Analysis window (line graph)
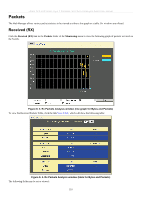
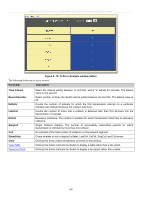
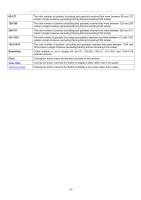
To view the Received Error Packets Table, click the link
View Table
, which will show the following table:
Figure 8- 10. Rx Error Analysis window (table)
The following fields can be set: