HP 2000sa RAID 6 with HP Advanced Data Guarding technology: a cost-effective, - Page 8
Performance of RAID schemes, application. Applications such as ERP, transaction processing
 |
View all HP 2000sa manuals
Add to My Manuals
Save this manual to your list of manuals |
Page 8 highlights
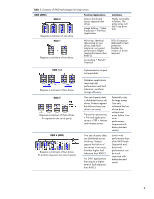
Table 2. Summary of RAID array storage efficiency* Usable Capacity (C = capacity of smallest drive; n = number of drives) Minimum number of drives Recommended maximum number of drives* Storage efficiency from minimum to recommended maximum number of drives** RAID 1 C*(n/2) 2 N/A 50% RAID 1+0 C*(n/2) RAID 5 C*(n-1) 4 N/A 50% 3 14 67% to 93% RAID 6 (ADG) C*(n-2) 4 N/A 50% to 96% *HP recommends not exceeding these maximum figures (excluding any allowable online spares) when configuring a drive array, due to the increased likelihood of drive array failure if more hard drives are added. **The value for storage efficiency is calculated by assuming all drives in the array have the same capacity and that there are no online spares in the array. Performance of RAID schemes The key to RAID performance is parallelism-the ability to access multiple disks simultaneously. Parallelism allows data to be written to or read from a RAID array faster than would be possible with a single drive. Analyzing RAID performance can be very complicated because several factors must be considered (sequential versus random reads and writes, block size, data transfer rate, etc). The performance of a RAID array can be subdivided into read performance and write performance; both will vary based on the RAID level. • RAID 0 uses striping to improve performance by distributing user data across multiple hard disks; however, RAID 0 has no fault tolerance. • RAID 1 (mirroring) writes the data and redundant data to two separate drives. The data is normally read from one drive, so the read performance is much faster than the write performance; however, half of the data can be read from each drive to further increase the read performance. • RAID 5 and RAID 6 also use striping, but their write performance is significantly affected by the multiple reads and writes needed to perform the parity calculations prior to updating the array. The write performance of RAID 6 is less than that of RAID 5 because RAID 6 has dual parity overhead. The read performance of RAID 5 and RAID 6 is very good and may be improved by adjusting the stripe size. In the final analysis, RAID array performance boundaries are largely predetermined by the intended application. Applications such as ERP, transaction processing, and web servers⎯which require a high-capacity array but have a relatively low ratio of writes to reads⎯may benefit from striping with parity: RAID 5 or RAID 6. On the other hand, file servers, database servers, and media development servers⎯applications that have a much higher ratio of writes to reads⎯may benefit from a RAID 1+0 array. However, with RAID 1+0 arrays, cost eventually becomes an issue as capacity requirements grow. 8
-
 1
1 -
2
-
 3
3 -
 4
4 -
 5
5 -
 6
6 -
 7
7 -
 8
8 -
 9
9 -
 10
10
 |
 |
