HP ProLiant 3000 Microsoft Exchange Server 5.5 on the Compaq ProLiant 3000 - Page 8
Performance results measured using Microsoft NT Performance Monitor. Measurements
 |
View all HP ProLiant 3000 manuals
Add to My Manuals
Save this manual to your list of manuals |
Page 8 highlights
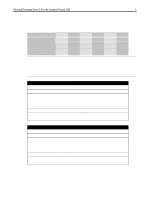
Performance Data Disclosure (Configuration A) (Measured during test run at steady state) Indicator 1000 Users 2000 Users 3000 Users 4000 Users 5000 users Response Time (ms) 92 102 130 181 249 IS Buffer Cache Hit % 99.53% 99.29% 99.19% 99.11% 98.72% Disk Queue Length - IS Volume Disk Queue Length - Log Volume Average Read I/Os - IS 0.225 0.008 12.552 0.68 0.015 39.884 1.29 0.02 72.177 2.442 0.026 118.071 4.828 0.029 196.096 Average Write I/Os - IS 8.119 24.126 39.247 56.217 76.195 Average Write I/Os - Log 20.951 37.80 51.083 63.611 71.824 Average Pages/Sec 0.022 0.036 0.046 0.092 0.131 Average Available Bytes 4.85MB 4.94MB 4.89MB 4.88MB 4.86MB IS Send Queue Average 0.01 0.172 0.293 0.596 2.273 IS Receive Queue Average 0.707 0.545 0.515 0.626 0.818 MTA Work Queue Average 0.051 0.111 0.232 0.303 0.556 Messages Open/sec 4.069 8.076 11.905 16.334 19.784 Average RPC Operations/sec 49.941 99.412 147.227 200.172 245.75 Messages Submitted (8hours) Calculated Messages/User 14892 14.892 30284 15.142 44815 14.938 60718 15.179 74516 14.90 Average CPU Utilization 6.40% 14.53% 23.55% 35.86% 55.08% Average Context Switches/Sec Average CPU Queue Length 498 0.152 855 0.303 1210 0.687 1582 1.141 1954 1.818 Working Set - STORE 420MB 467MB 464MB 463MB 462MB Virtual Bytes - STORE 724MB 773MB 793MB 805MB 835MB NOTE: Performance results measured using Microsoft NT Performance Monitor. Measurements were obtained by measuring averages for the period of steady-state activity (i.e. after 5,000 users were successfully logged on). Tests measure the messaging throughput of a single server, single site topology. For deployment specific information contact a Microsoft or Compaq representative. More information can be found at: http://www.microsoft.com/exchange/support/deployment/planning/deploy.asp?A=5&B=1 ECG096/0998
-
 1
1 -
2
-
 3
3 -
 4
4 -
 5
5 -
 6
6 -
 7
7 -
 8
8 -
 9
9 -
 10
10
 |
 |
