HP Surestore 6164 Web Tools User's Guide (Version 3.0) - Page 105
SID/DID Performance Graph, Switch View, SID/DID Performance Setup Data Entry Window
 |
View all HP Surestore 6164 manuals
Add to My Manuals
Save this manual to your list of manuals |
Page 105 highlights
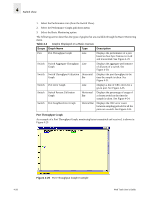
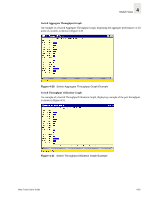
4 Switch View SID/DID Performance Graph When you select the SID/DID Performance Graph, you will be prompted with a data entry window where you will chose the SID and DID to be charted. Figure 4-36 is an example of the data entry window that you will see when you choose to create a SID/DID Performance Graph. Figure 4-36 SID/DID Performance Setup Data Entry Window To choose the port and SID/DID that you want to graph: 1. Double-click on a folder in the Port Selection List window. A drop-down list of ports will appear. 2. Select the port that you want to monitor or change by using one of the following methods: • Type the port number in the Enter /Drag Port Numbers window. • Drag the port "folder" from the Port Selection window to the Enter/Drag Port Number window. 3. Select the port "folder", or the small icon that appears next to it. A drop-down list of SID/DID files will appear. 4. Select the SID/DID numbers that you want to graph by using one of the following methods: • Type the SID number in the Enter /drag SID Numbers window. Repeat for the DID number. • Drag the SID "file" from the Port Selection window to the Enter/drag SID Number window. Repeat for the DID number. 5. Select OK. A graph displaying the CRC errors for the chosen port will be displayed. An example of an SID/DID graph, displaying the traffic between a SID and a DID pair, is shown in Figure 4-37. Web Tools User's Guide 4-33
-
 1
1 -
2
-
3
-
4
-
5
-
6
-
7
-
8
-
9
-
10
-
11
-
12
-
13
-
14
-
15
-
16
-
17
-
18
-
19
-
20
-
21
-
22
-
23
-
24
-
25
-
26
-
27
-
28
-
29
-
30
-
31
-
32
-
33
-
34
-
35
-
36
-
37
-
38
-
39
-
40
-
41
-
42
-
43
-
44
-
45
-
46
-
47
-
48
-
49
-
50
-
51
-
52
-
53
-
54
-
55
-
56
-
57
-
58
-
59
-
60
-
61
-
62
-
63
-
64
-
65
-
66
-
67
-
68
-
69
-
70
-
71
-
72
-
73
-
74
-
75
-
76
-
77
-
78
-
79
-
80
-
81
-
82
-
83
-
84
-
85
-
86
-
87
-
88
-
89
-
90
-
91
-
92
-
93
-
94
-
95
-
96
-
97
-
98
-
99
-
 100
100 -
 101
101 -
 102
102 -
 103
103 -
 104
104 -
 105
105 -
 106
106 -
 107
107 -
 108
108 -
 109
109 -
 110
110 -
111
-
112
-
113
-
114
-
115
-
116
-
117
-
118
-
119
-
120
-
121
-
122
-
123
-
124
-
125
-
126
-
127
-
128
-
129
-
130
-
131
-
132
-
133
-
134
-
135
-
136
-
137
-
138
-
139
-
140
-
141
-
142
-
143
-
144
-
145
-
146
-
147
-
148
-
149
-
150
-
151
-
152
-
153
-
154
-
155
-
156
-
157
-
158
-
159
-
160
-
161
 |
 |
