Lowrance HDS-7 Gen3 Operators Manual US - Page 43
Navionics view options, Chart shading, Navionics dynamic tide and current icons
 |
View all Lowrance HDS-7 Gen3 manuals
Add to My Manuals
Save this manual to your list of manuals |
Page 43 highlights
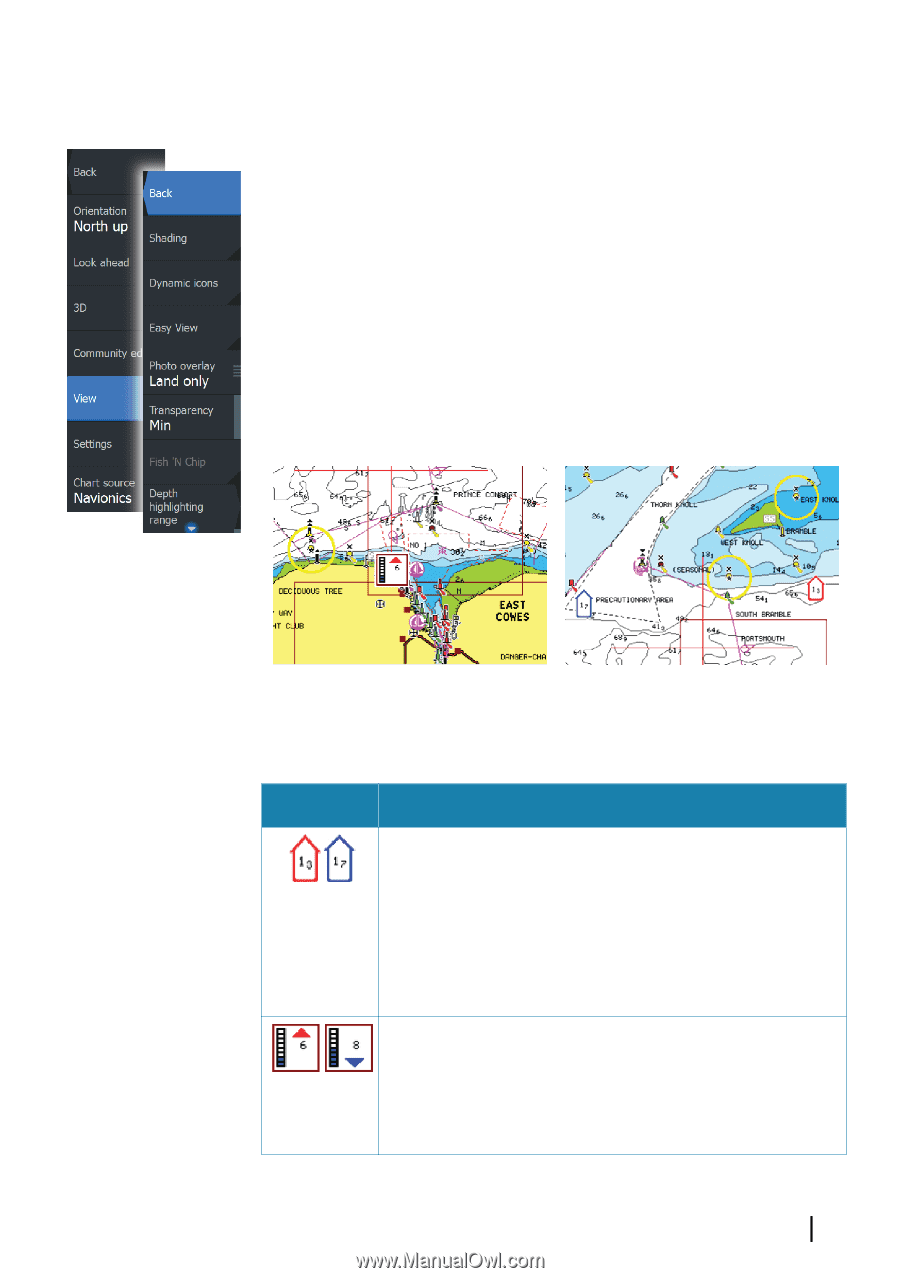
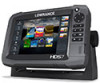
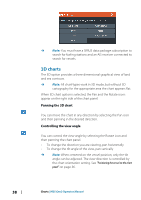
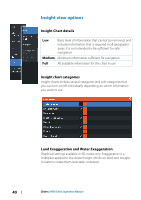
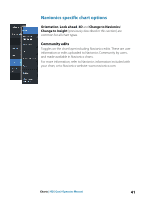
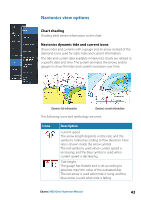
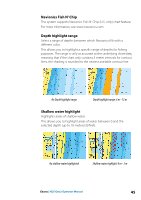
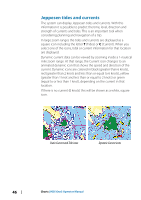
Navionics view options Chart shading Shading adds terrain information to the chart. Navionics dynamic tide and current icons Shows tides and currents with a gauge and an arrow instead of the diamond icons used for static tides and current information. The tide and current data available in Navionics charts are related to a specific date and time. The system animates the arrows and/or gauges to show the tides and currents evolution over time. Dynamic tide information Dynamic current information The following icons and symbology are used: Icons Description Current speed. The arrow length depends on the rate, and the symbol is rotated according to flow direction. Flow rate is shown inside the arrow symbol. The red symbol is used when current speed is increasing, and the blue symbol is used when current speed is decreasing. Tide height. The gauge has 8 labels and is set according to absolute max/min value of the evaluated day. The red arrow is used when tide is rising, and the blue arrow is used when tide is falling. Charts | HDS Gen3 Operator Manual 43
-
 1
1 -
2
-
3
-
4
-
5
-
6
-
7
-
8
-
9
-
10
-
11
-
12
-
13
-
14
-
15
-
16
-
17
-
18
-
19
-
20
-
21
-
22
-
23
-
24
-
25
-
26
-
27
-
28
-
29
-
30
-
31
-
32
-
33
-
34
-
35
-
36
-
37
-
 38
38 -
 39
39 -
 40
40 -
 41
41 -
 42
42 -
 43
43 -
 44
44 -
 45
45 -
 46
46 -
 47
47 -
 48
48 -
49
-
50
-
51
-
52
-
53
-
54
-
55
-
56
-
57
-
58
-
59
-
60
-
61
-
62
-
63
-
64
-
65
-
66
-
67
-
68
-
69
-
70
-
71
-
72
-
73
-
74
-
75
-
76
-
77
-
78
-
79
-
80
-
81
-
82
-
83
-
84
-
85
-
86
-
87
-
88
-
89
-
90
-
91
-
92
-
93
-
94
-
95
-
96
-
97
-
98
-
99
-
100
-
101
-
102
-
103
-
104
-
105
-
106
-
107
-
108
-
109
-
110
-
111
-
112
-
113
-
114
-
115
-
116
-
117
-
118
-
119
-
120
-
121
-
122
-
123
-
124
-
125
-
126
-
127
-
128
-
129
-
130
-
131
-
132
-
133
-
134
-
135
-
136
-
137
-
138
-
139
-
140
-
141
-
142
-
143
-
144
-
145
-
146
-
147
-
148
-
149
-
150
-
151
-
152
-
153
-
154
-
155
-
156
-
157
-
158
-
159
-
160
-
161
-
162
-
163
-
164
-
165
-
166
 |
 |