Lowrance HDS-9 Gen3 Operators Manual US - Page 87
StructureMap sources, Live source, Saved files
 |
View all Lowrance HDS-9 Gen3 manuals
Add to My Manuals
Save this manual to your list of manuals |
Page 87 highlights
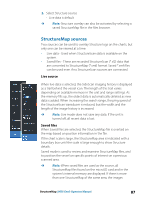
2. Select Structure source - Live data is default Ú Note: Structure overlay can also be activated by selecting a saved StructureMap file in the files browser. StructureMap sources Two sources can be used to overlay Structure logs on the charts, but only one can be viewed at a time: • Live data - Used when StructureScan data is available on the system. • Saved files - These are recorded StructureScan (*.sl2) data that are converted to StructureMap (*.smf) format. Saved *.smf files can be used even if no StructureScan sources are connected. Live source When live data is selected, the SideScan imaging history is displayed as a trail behind the vessel icon. The length of this trail varies depending on available memory in the unit and range settings. As the memory fills up, the oldest data is automatically deleted as new data is added. When increasing the search range, the ping speed of the StructureScan transducer is reduced, but the width and the length of the image history is increased. Ú Note: Live mode does not save any data. If the unit is turned off, all recent data is lost. Saved files When Saved files are selected, the StructureMap file is overlaid on the map based on position information in the file. If the chart scale is large, the StructureMap area is indicated with a boundary box until the scale is large enough to show Structure details. Saved mode is used to review and examine StructureMap files, and to position the vessel on specific points of interest on a previous scanned area. Ú Note: When saved files are used as the source, all StructureMap files found on the microSD card and in the system's internal memory are displayed. If there is more than one StructureMap of the same area, the images StructureMap | HDS Gen3 Operator Manual 87
-
 1
1 -
2
-
3
-
4
-
5
-
6
-
7
-
8
-
9
-
10
-
11
-
12
-
13
-
14
-
15
-
16
-
17
-
18
-
19
-
20
-
21
-
22
-
23
-
24
-
25
-
26
-
27
-
28
-
29
-
30
-
31
-
32
-
33
-
34
-
35
-
36
-
37
-
38
-
39
-
40
-
41
-
42
-
43
-
44
-
45
-
46
-
47
-
48
-
49
-
50
-
51
-
52
-
53
-
54
-
55
-
56
-
57
-
58
-
59
-
60
-
61
-
62
-
63
-
64
-
65
-
66
-
67
-
68
-
69
-
70
-
71
-
72
-
73
-
74
-
75
-
76
-
77
-
78
-
79
-
80
-
81
-
 82
82 -
 83
83 -
 84
84 -
 85
85 -
 86
86 -
 87
87 -
 88
88 -
 89
89 -
 90
90 -
 91
91 -
 92
92 -
93
-
94
-
95
-
96
-
97
-
98
-
99
-
100
-
101
-
102
-
103
-
104
-
105
-
106
-
107
-
108
-
109
-
110
-
111
-
112
-
113
-
114
-
115
-
116
-
117
-
118
-
119
-
120
-
121
-
122
-
123
-
124
-
125
-
126
-
127
-
128
-
129
-
130
-
131
-
132
-
133
-
134
-
135
-
136
-
137
-
138
-
139
-
140
-
141
-
142
-
143
-
144
-
145
-
146
-
147
-
148
-
149
-
150
-
151
-
152
-
153
-
154
-
155
-
156
-
157
-
158
-
159
-
160
-
161
-
162
-
163
-
164
-
165
-
166
 |
 |
