Texas Instruments TI15TK Teacher Guide - Page 10
Analyzing Data and Drawing Conclusions, Continuing the Investigation, Continued
 |
UPC - 100000000137
View all Texas Instruments TI15TK manuals
Add to My Manuals
Save this manual to your list of manuals |
Page 10 highlights
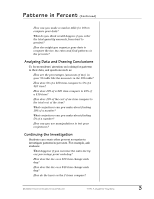
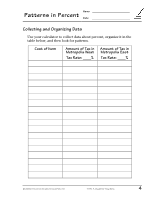
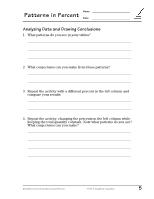
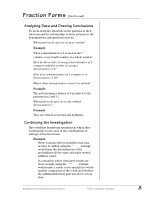
Patterns in Percent (Continued) • How can you make a similar table for 10% to compare your data? • What do you think would happen if you order the total quantity amounts from least to greatest? • How else might you organize your data to compare the two tax rates and find patterns in the percents? Analyzing Data and Drawing Conclusions To focus students' attention on looking for patterns in their data, ask questions such as: • How are the percentages (amounts of tax) in your 5% table like the amounts in the 10% table? • How does 5% of a $20 item compare to 5% of a $10 item? • How does 10% of a $20 item compare to 10% of a $10 item? • How does 10% of the cost of an item compare to the total cost of the item? • What conjectures can you make about finding 10% of a number? • What conjectures can you make about finding 5% of a number? • How can you use manipulatives to test your conjectures? Continuing the Investigation Students can create other percent scenarios to investigate patterns in percents. For example, ask students: • What happens if you increase the sales tax by one percentage point each day? • How does the tax on a $20 item change each day? • How does the tax on a $40 item change each day? • How do the taxes on the 2 items compare? © 2000 TEXAS INSTRUMENTS INCORPORATED TI-15: A Guide for Teachers 3
-
 1
1 -
2
-
3
-
4
-
 5
5 -
 6
6 -
 7
7 -
 8
8 -
 9
9 -
 10
10 -
 11
11 -
 12
12 -
 13
13 -
 14
14 -
 15
15 -
16
-
17
-
18
-
19
-
20
-
21
-
22
-
23
-
24
-
25
-
26
-
27
-
28
-
29
-
30
-
31
-
32
-
33
-
34
-
35
-
36
-
37
-
38
-
39
-
40
-
41
-
42
-
43
-
44
-
45
-
46
-
47
-
48
-
49
-
50
-
51
-
52
-
53
-
54
-
55
-
56
-
57
-
58
-
59
-
60
-
61
-
62
-
63
-
64
-
65
-
66
-
67
-
68
-
69
-
70
-
71
-
72
-
73
-
74
-
75
-
76
-
77
-
78
-
79
-
80
-
81
-
82
-
83
-
84
-
85
-
86
-
87
-
88
-
89
-
90
-
91
-
92
-
93
-
94
-
95
-
96
-
97
-
98
-
99
-
100
-
101
-
102
-
103
-
104
-
105
-
106
-
107
-
108
-
109
-
110
-
111
-
112
-
113
-
114
-
115
-
116
-
117
-
118
-
119
-
120
-
121
-
122
-
123
-
124
-
125
-
126
 |
 |
