Yamaha MSP5 Owner's Manual - Page 15
Block Diagram, Performance graph, Schéma, Graphique de performance, Blockschaltbild, Frequenzgrafik
 |
UPC - 086792856711
View all Yamaha MSP5 manuals
Add to My Manuals
Save this manual to your list of manuals |
Page 15 highlights
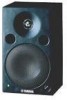
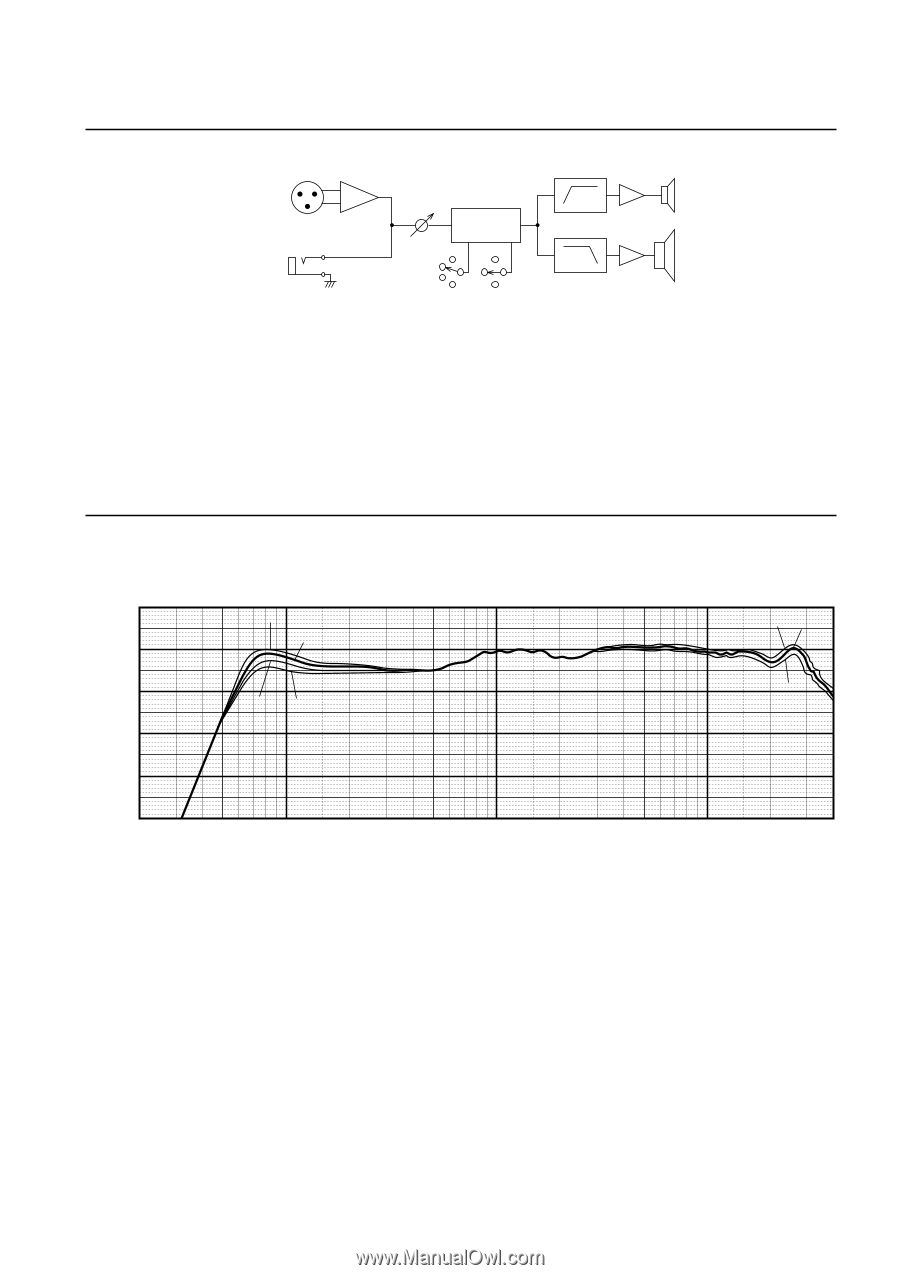
Block Diagram/Schéma/Blockschaltbild/Diagrama en bloques LINE 1 HF INPUT TRIM VOL LF LINE 2 LOW HIGH TRIM Performance graph/Graphique de performance/ Frequenzgrafik/Gráfico de operación RESPONSE [dB] 100 90 80 70 60 50 20 +1 0 -1 -2 50 100 200 500 1k 2k FREQUENCY [Hz] 1 W at 1 kHz / 1 m on Axis An acoustically-dampened room +1 0 -1 5k 10k 20k 40k 15
-
 1
1 -
2
-
3
-
4
-
5
-
6
-
7
-
8
-
9
-
 10
10 -
 11
11 -
 12
12 -
 13
13 -
 14
14 -
 15
15 -
 16
16
 |
 |
15
Block Diagram/Sch
é
ma/Blockschaltbild/Diagrama en
bloques
HIGH
LOW
TRIM
INPUT
TRIM
HF
LF
VOL
LINE 1
LINE 2
Performance graph/Graphique de performance/
Frequenzgrafik/Gr
á
fico de operaci
ó
n
50
20
90
100
80
70
60
50
100
200
500
1k
2k
5k
10k
20k
40k
FREQUENCY [Hz]
RESPONSE [dB]
+1
0
–1
–2
+1
0
–1
1 W at 1 kHz / 1 m on Axis
An acoustically-dampened room