Casio FX 2.0 User Guide - Page 14
Dynamic Graph
 |
UPC - 079767191139
View all Casio FX 2.0 manuals
Add to My Manuals
Save this manual to your list of manuals |
Page 14 highlights
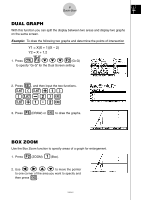
9 Quick-Start d e f c 3. Use to move the pointer again. As you do, a box appears on the display. Move the pointer so the box encloses the area you want to enlarge. w 4. Press , and the enlarged area appears in the inactive (right side) screen. DYNAMIC GRAPH Dynamic Graph lets you see how the shape of a graph is affected as the value assigned to one of the coefficients of its function changes. Example: To draw graphs as the value of coefficient A in the following function changes from 1 to 3 Y = AX2 m 1. Press . d e f c 2. Use to highlight DYNA, w and then press . 3. Input the formula. A avvxw 19990401 12356
-
 1
1 -
2
-
3
-
4
-
5
-
6
-
7
-
8
-
 9
9 -
 10
10 -
 11
11 -
 12
12 -
 13
13 -
 14
14 -
 15
15 -
 16
16 -
 17
17 -
 18
18 -
 19
19 -
20
-
21
-
22
-
23
-
24
 |
 |
19990401
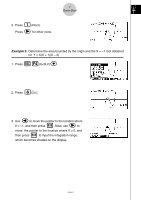
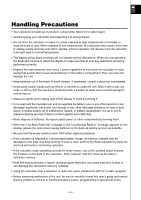
3. Use
d
e
f
c
to move the pointer
again. As you do, a box appears on the display.
Move the pointer so the box encloses the area
you want to enlarge.
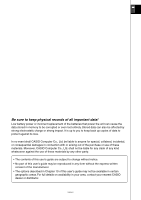
4. Press
w
, and the enlarged area appears in the
inactive (right side) screen.
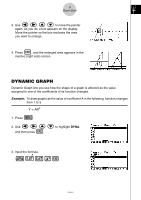
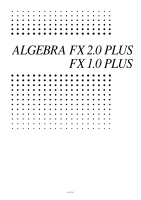
DYNAMIC GRAPH
Dynamic Graph lets you see how the shape of a graph is affected as the value
assigned to one of the coefficients of its function changes.
Example:
To draw graphs as the value of coefficient A in the following function changes
from 1 to 3
Y = AX
2
1. Press
m
.
2. Use
d
e
f
c
to highlight
DYNA
,
and then press
w
.
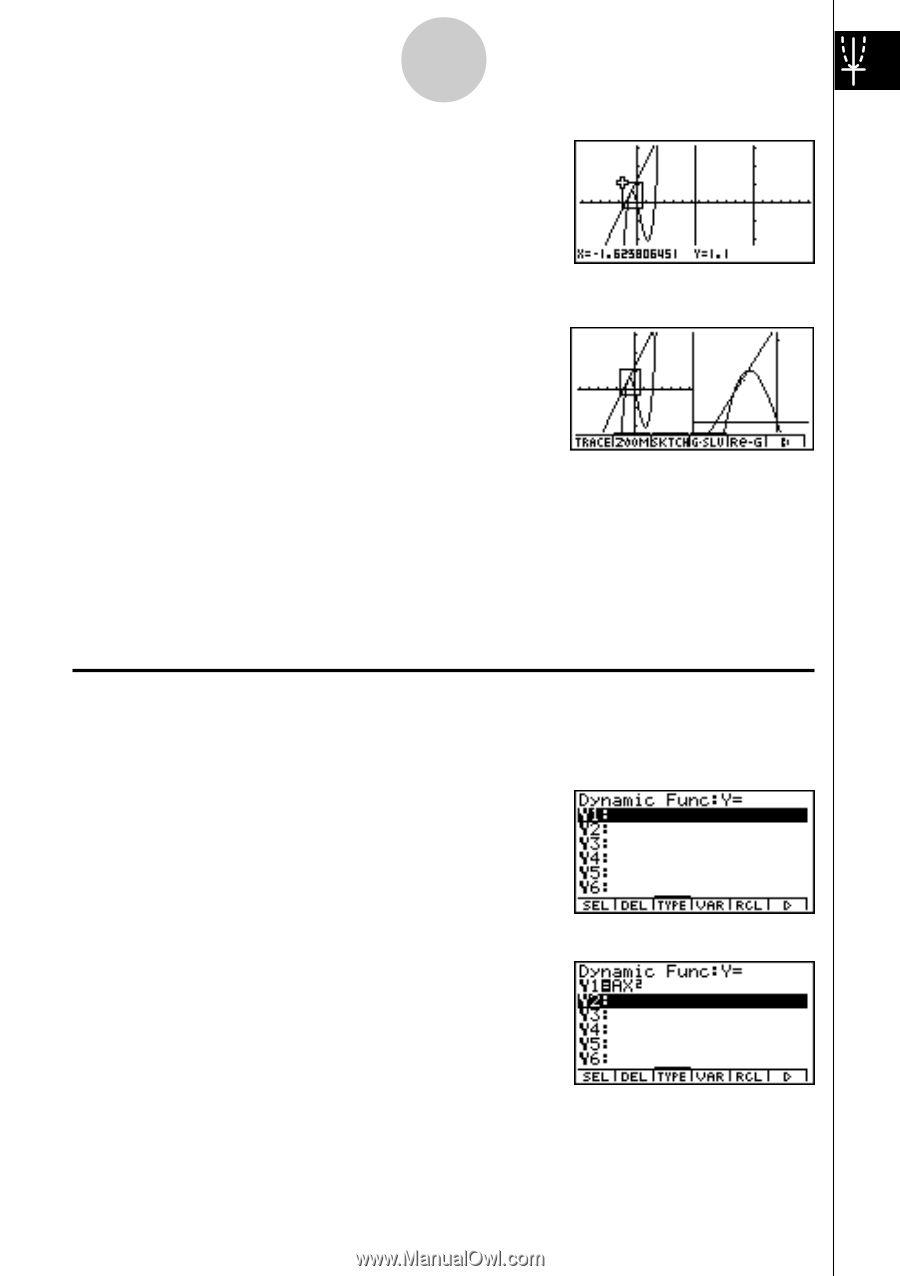
3. Input the formula.
av
A
vxw
12
3
56
9
Quick-Start