Casio FX 7400G User Guide - Page 8
Statistical Graph View Window Setting S-Wind - statistics
 |
UPC - 079767193218
View all Casio FX 7400G manuals
Add to My Manuals
Save this manual to your list of manuals |
Page 8 highlights
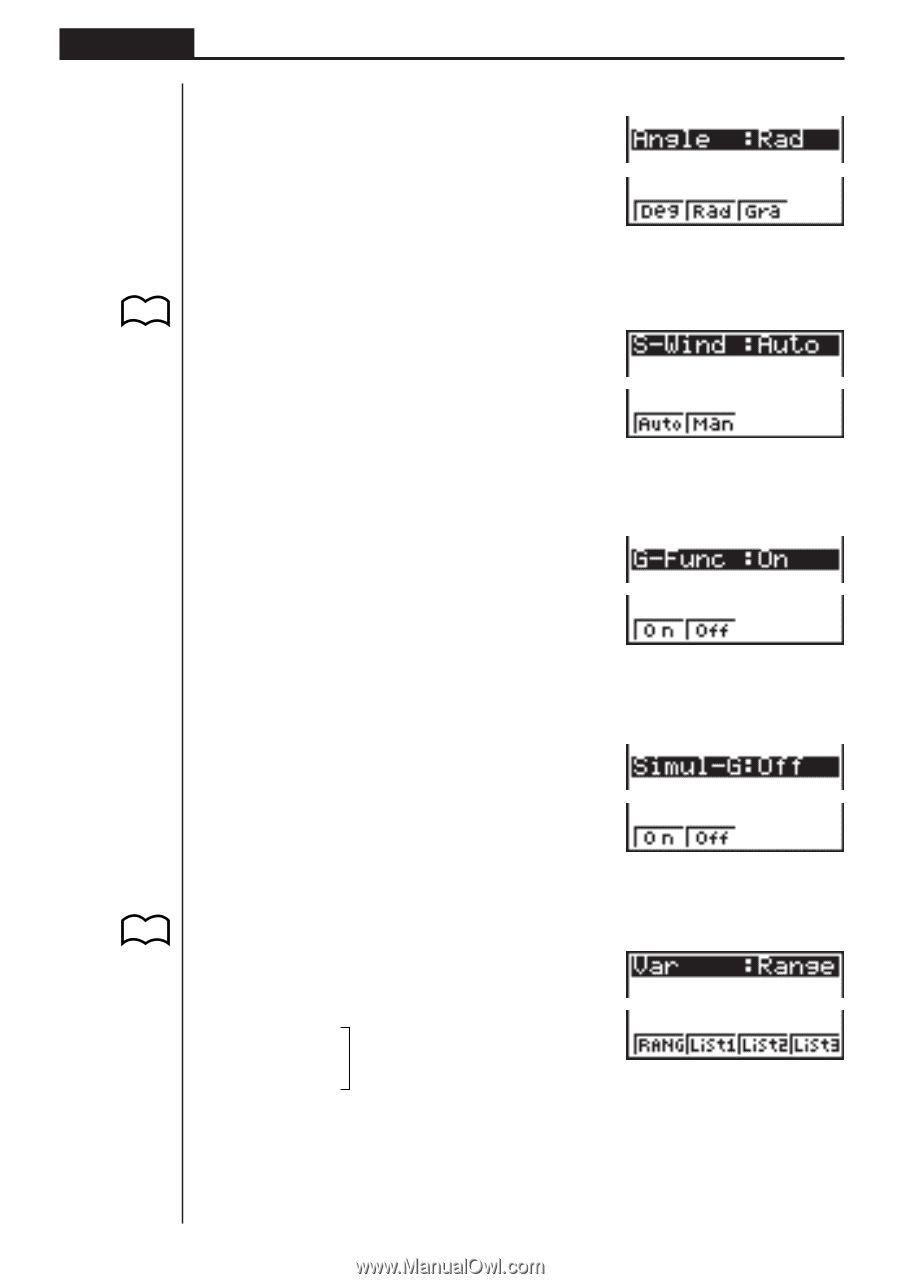
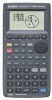
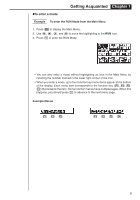
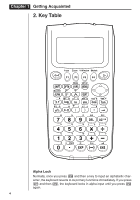
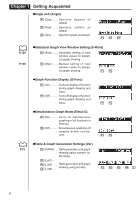
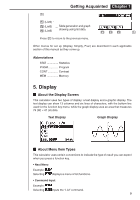
Chapter 1 Getting Acquainted uAngle unit (Angle) 1 (Deg) ........ Specifies degrees as default. 2 (Rad) ........ Specifies radians as default. 3 (Gra) ......... Specifies grads as default. 1234 P.120 P.120 P.75 uStatistical Graph View Window Setting (S-Wind) 1 (Auto) ........ Automatic setting of view window values for statistical graph drawing. 2 (Man) ........ Manual setting of view window values for statistical graph drawing. 1234 uGraph Function Display (G-Func) 1 (On Turns on display of function during graph drawing and trace. 2 (Off Turns off display of function during graph drawing and trace. 1234 uSimultaneous Graph Mode (Simul-G) 1 (On Turns on simultaneous graphing of all functions in memory. 2 (Off Simultaneous graphing off (graphs drawn one-byone). 1234 uTable & Graph Generation Settings (Var) 1 (RANG) .... Table generation and graph drawing using numeric table range. 2 (List1) 3 (List2) .... Table generation and graph 4 (List3) drawing using list data. 1 2 3 4[ 8
-
 1
1 -
2
-
 3
3 -
 4
4 -
 5
5 -
 6
6 -
 7
7 -
 8
8 -
 9
9 -
 10
10 -
 11
11 -
 12
12
 |
 |