Casio FX 7400G User Guide - Page 9
Display - graphics
 |
UPC - 079767193218
View all Casio FX 7400G manuals
Add to My Manuals
Save this manual to your list of manuals |
Page 9 highlights
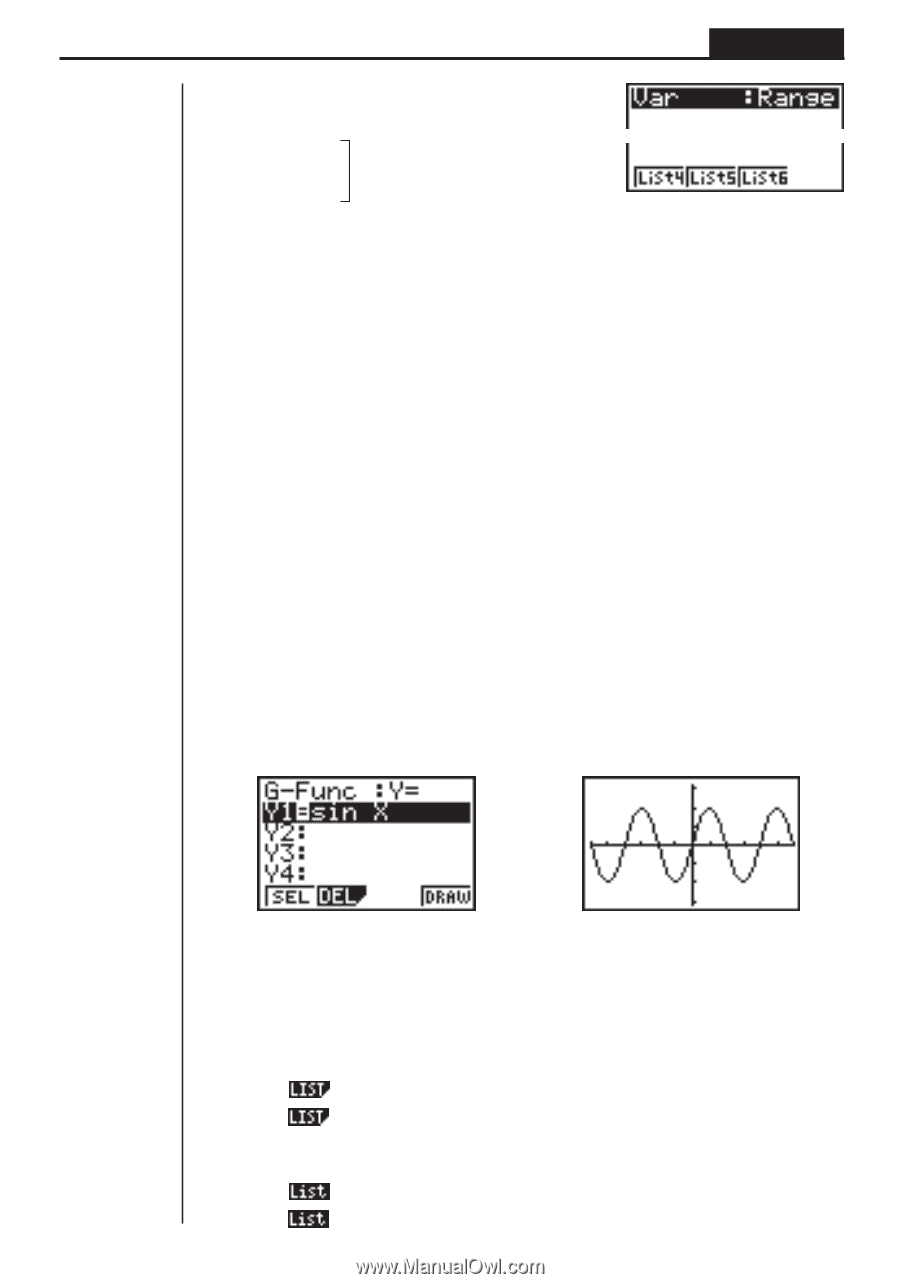
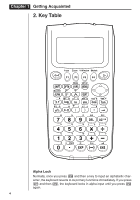
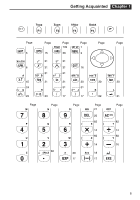
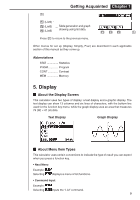
Getting Acquainted Chapter 1 [ 1 (List4) 2 (List5) 3 (List6) .... Table generation and graph drawing using list data. Press [ to return to the previous menu. 1 2 3 4[ Other menus for set up (Display, Simplfy, Frac) are described in each applicable section of this manual as they come up. Abbreviations STAT Statistics PRGM Program CONT Contrast MEM Memory 5. Display k About the Display Screen This calculator uses two types of display: a text display and a graphic display. The text display can show 13 columns and six lines of characters, with the bottom line used for the function key menu, while the graph display uses an area that measures 79 (W) × 47 (H) dots. Text Display Graph Display k About Menu Item Types This calculator uses certain conventions to indicate the type of result you can expect when you press a function key. • Next Menu Example: Selecting displays a menu of list functions. • Command Input Example: Selecting inputs the "List" command. 9
-
 1
1 -
2
-
3
-
 4
4 -
 5
5 -
 6
6 -
 7
7 -
 8
8 -
 9
9 -
 10
10 -
 11
11 -
 12
12
 |
 |