Casio FX-991ES User Guide - Page 51
Distr Sub-menu, Distr, Standard Normal Distribution - stat
 |
View all Casio FX-991ES manuals
Add to My Manuals
Save this manual to your list of manuals |
Page 51 highlights
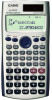
Distr Sub-menu (11(STAT)7(Distr)) 1 P( 2 Q( 3 R( 4 't This menu can be used to calculate the probability of standard normal distribution. Normalized variate t is calculated with the expression shown below, using the mean value (o) and population standard deviation value (xσn) obtained from the data input on the STAT editor screen. Standard Normal Distribution P (t) Q (t) R (t) 0 t 0 t 0 t Appendix Single-variable Statistical Calculation Select single-variable (1-VAR) and input the following data: {1, 2, 3, 4, 5, 6, 7, 8, 9, 10} (FREQ: ON) Edit the data to the following, using insert and delete: {0, 1, 2, 3, 4, 5, 6, 7, 9, 10} (FREQ: ON) Edit the FREQ data to the following: {1, 2, 1, 2, 2, 2, 3, 4, 2, 1} (FREQ: ON) • Examples through all use the same data as Example . Calculate sum of squares of the sample data and sum of the sample data. Calculate number of samples, mean, and population standard deviation. Calculate minimum value and maximum value. Performing standard normal distribution approximation on the input sample data (from Example ) produces the probabilities shown below. Distribution probability that is a value less than the normalized variate when the sample value is 3 (P value for normalized variate when X = 3) Distribution probability that is a value greater than the normalized variate when the sample value is 7 (R value for normalized variate when X = 7) E-49
-
 1
1 -
2
-
3
-
4
-
5
-
6
-
7
-
8
-
9
-
10
-
11
-
12
-
13
-
14
-
15
-
16
-
17
-
18
-
19
-
20
-
21
-
22
-
23
-
24
-
25
-
26
-
27
-
28
-
29
-
30
-
31
-
32
-
33
-
34
-
35
-
36
-
37
-
38
-
39
-
40
-
41
-
42
-
43
-
44
-
45
-
 46
46 -
 47
47 -
 48
48 -
 49
49 -
 50
50 -
 51
51 -
 52
52 -
 53
53 -
 54
54 -
 55
55 -
 56
56 -
57
-
58
-
59
-
60
-
61
-
62
-
63
-
64
-
65
-
66
-
67
-
68
-
69
-
70
-
71
-
72
-
73
-
74
-
75
 |
 |
