Compaq 307560-001 Performance Analysis and Capacity Planning for Microsoft Sit - Page 15
requested/sec and the Average Connect Time sec measurements, which come from WCAT.
 |
UPC - 743172470379
View all Compaq 307560-001 manuals
Add to My Manuals
Save this manual to your list of manuals |
Page 15 highlights
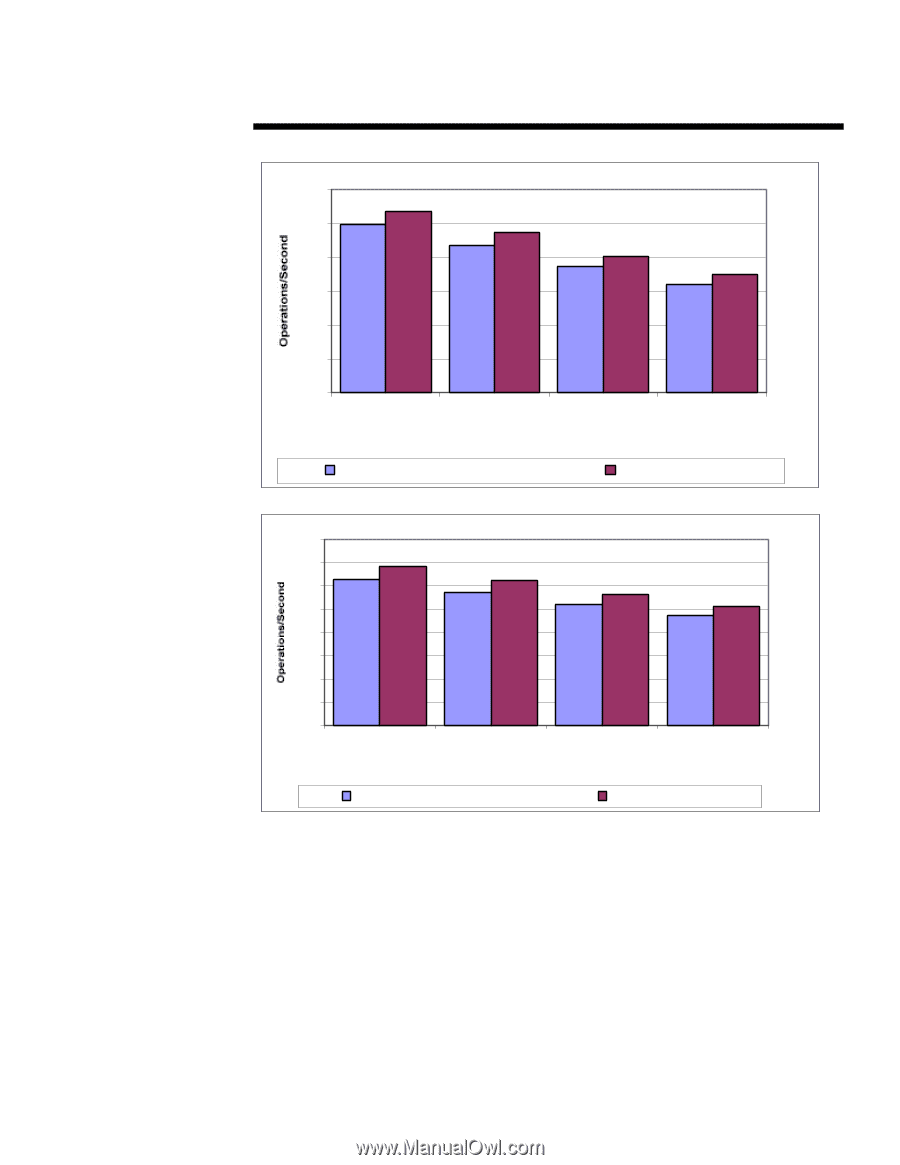
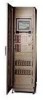
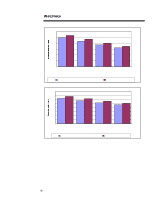
WHITE PAPER (cont.) 1...5 60.0 53.5 50.0 49.6 40.0 30.0 47.3 43.5 40.3 37.2 32.1 35.0 20.0 10.0 0.0 1,000 10,000 100,000 User Community Size 1,000,000 Web pages requested/sec Figure 3: ProLiant 2500 PS Performance Summary ASP requests/sec 80.0 70.0 68.2 63.0 60.0 50.0 40.0 30.0 20.0 10.0 0.0 1,000 62.4 57.3 51.8 56.3 10,000 100,000 User Community Size 51.2 47.1 1,000,000 Web pages requested/sec ASP requests/sec Figure 4: ProLiant 7000 PS Performance Summary All measurements in Tables 13 and 14 come from perfmon, except for the "Web pages requested/sec" and the "Average Connect Time (sec)" measurements, which come from WCAT. The "Available Memory" measurement is the last sample taken during the test. This value was used because it shows how much memory is available at the end of the test. This measurement, gives a good indication as to whether or not performance could be improved by adding more memory.
-
 1
1 -
2
-
3
-
4
-
5
-
6
-
7
-
8
-
9
-
 10
10 -
 11
11 -
 12
12 -
 13
13 -
 14
14 -
 15
15 -
 16
16 -
 17
17 -
 18
18 -
 19
19 -
 20
20 -
21
-
22
-
23
-
24
-
25
-
26
 |
 |