Compaq 307560-001 Performance Analysis and Capacity Planning for Microsoft Sit - Page 18
ProLiant 7000 PS Bottlenecks
 |
UPC - 743172470379
View all Compaq 307560-001 manuals
Add to My Manuals
Save this manual to your list of manuals |
Page 18 highlights
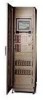
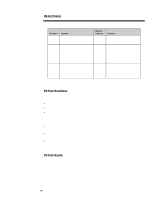
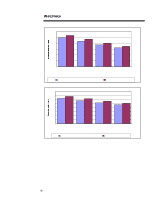
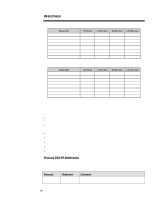
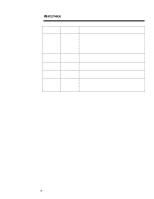
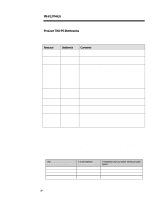
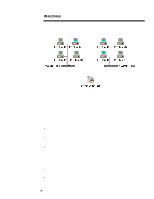
WHITE PAPER (cont.) 1...8 ProLiant 7000 PS Bottlenecks Analysis of PS bottlenecks on the ProLiant 7000 shows: Table 16: ProLiant 7000 Analysis of PS Bottlenecks Resource Bottleneck Comments CPU No The CPU utilization decreases as the number of users in the UPD increases. Network No The total network traffic is less than 15% of the available bandwidth. Memory No There is over 200 MB of memory available. The "Pages/sec" measurement shows a high page fault rate with larger UPDs. The cause is most likely that PS is using memory-mapped files. The Physical Disk perfmon measurements support this conclusion because the disks are busy four times as much with reads than they are with writes. Operating No System Web Server Software (IIS) PS Software Possible Possible Disk Yes Subsystem The web server may be a bottleneck as the number of ASPenabled web pages requested increases. PS may be a bottleneck as the number of concurrent users increases. See the analysis for the PS Software above Test Lab The test lab configuration used for the ProLiant 2500 testing is shown in Figure 5. The number of client systems needed was determined by adding one at a time until the ProLiant 2500's CPU was driven to 100% utilization. Table 17 shows the actual number of client systems used and the configurations for each test. There was always one network for the ProLiant 2500 tests. Table17: ProLiant 2500 Test Lab Configuration Test # of Client Systems ILS Connect 5 ILS Add 2 ILS Direct Lookup 4 All PS Tests 3 # of Simulated Users and Worker Threads per Client System 50 20 50 11
-
 1
1 -
2
-
3
-
4
-
5
-
6
-
7
-
8
-
9
-
10
-
11
-
12
-
 13
13 -
 14
14 -
 15
15 -
 16
16 -
 17
17 -
 18
18 -
 19
19 -
 20
20 -
 21
21 -
 22
22 -
 23
23 -
24
-
25
-
26
 |
 |