Garmin Forerunner 45/45S Owners Manual - Page 13
Getting Your VO2 Max. Estimate for Running, Recovery Time, Viewing Your Predicted Race Times, Heart - forerunner 45s
 |
View all Garmin Forerunner 45/45S manuals
Add to My Manuals
Save this manual to your list of manuals |
Page 13 highlights
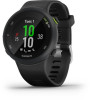
Getting Your VO2 Max. Estimate for Running This feature requires wrist-based heart rate or a compatible chest heart rate monitor. If you are using a chest heart rate monitor, you must put it on and pair it with your device (Pairing Your ANT+ Sensors, page 11). For the most accurate estimate, complete the user profile setup (Setting Up Your User Profile, page 12), and set your maximum heart rate (Setting Your Maximum Heart Rate, page 8). The estimate may seem inaccurate at first. The device requires a few runs to learn about your running performance. 1 Run for at least 10 minutes outdoors. 2 After your run, select Save. A notification appears to display your first VO2 max. estimate and each time your VO2 max. increases. About VO2 Max. Estimates VO2 max. is the maximum volume of oxygen (in milliliters) you can consume per minute per kilogram of body weight at your maximum performance. In simple terms, VO2 max. is an indication of athletic performance and should increase as your level of fitness improves. The Forerunner device requires wristbased heart rate or a compatible chest heart rate monitor to display your VO2 max. estimate. On the device, your VO2 max. estimate appears as a number, description, and position on the color gauge. On your Garmin Connect account, you can view additional details about your VO2 max. estimate, including your fitness age. Your fitness age gives you an idea of how your fitness compares with a person of the same gender and different age. As you exercise, your fitness age can decrease over time. Viewing Your Recovery Time For the most accurate estimate, complete the user profile setup (Setting Up Your User Profile, page 12), and set your maximum heart rate (Setting Your Maximum Heart Rate, page 8). 1 Go for a run. 2 After your run, select Save. The recovery time appears. The maximum time is 4 days. NOTE: From the watch face, you can select UP or DOWN to view the performance widget, and select START to scroll through the performance measurements to view your recovery time. Viewing Your Predicted Race Times NOTE: This feature is available only on the Forerunner 45 Plus device. For the most accurate estimate, complete the user profile setup (Setting Up Your User Profile, page 12), and set your maximum heart rate (Setting Your Maximum Heart Rate, page 8). Your device uses the VO2 max. estimate (About VO2 Max. Estimates, page 9) and your training history to provide a target race time. The device analyzes several weeks of your training data to refine the race time estimates. TIP: If you have more than one Garmin device, you can enable the Physio TrueUp™ feature, which allows your device to sync activities, history, and data from other devices (Syncing Activities, page 6). 1 From the watch face, select UP or DOWN to view the performance widget. 2 Select START to scroll through the performance measurements. Your projected race times appear for 5K, 10K, half marathon, and marathon distances. NOTE: The projections may seem inaccurate at first. The device requires a few runs to learn about your running performance. Purple Blue Green Yellow Red Superior Excellent Good Fair Poor VO2 max. data is provided by FirstBeat. VO2 max. analysis is provided with permission from The Cooper Institute®. For more information, see the appendix (VO2 Max. Standard Ratings, page 18), and go to www.CooperInstitute.org. Recovery Time You can use your Garmin device with wrist-based heart rate or a compatible chest heart rate monitor to display how much time remains before you are fully recovered and ready for the next hard workout. NOTE: This feature is available only on the Forerunner 45 Plus device. NOTE: The recovery time recommendation uses your VO2 max. estimate and may seem inaccurate at first. The device requires you to complete a few activities to learn about your performance. The recovery time appears immediately following an activity. The time counts down until it is optimal for you to attempt another hard workout. Heart Rate Variability and Stress Level Stress level is the result of a three-minute test performed while standing still, where the Forerunner device analyzes heart rate variability to determine your overall stress. Training, sleep, nutrition, and general life stress all impact how a runner performs. The stress level range is from 1 to 100, where 1 is a very low stress state and 100 is a very high stress state. Knowing your stress level can help you decide if your body is ready for a tough training run or yoga. Using the Stress Level Widget The stress level widget displays your current stress level and a graph of your stress level for the last several hours. It can also guide you through a breathing activity to help you relax. 1 While you are sitting or inactive, select UP or DOWN to view the stress level widget. 2 Select START. • If your stress level is in the low or medium range, a graph appears showing your stress level for the last four hours. TIP: To start a relaxation activity from the graph, select DOWN > START, and enter a duration in minutes. • If your stress level is in the high range, a message appears asking you to begin a relaxation activity. 3 Select an option: • View your stress level graph. Heart Rate Features 9
-
 1
1 -
2
-
3
-
4
-
5
-
6
-
7
-
 8
8 -
 9
9 -
 10
10 -
 11
11 -
 12
12 -
 13
13 -
 14
14 -
 15
15 -
 16
16 -
 17
17 -
 18
18 -
19
-
20
-
21
-
22
-
23
-
24
-
25
-
26
 |
 |
