HP 12C#ABA hp 12c_solutions handbook_English_E.pdf - Page 60
Profit and Loss Analysis - calculator simulator
 |
UPC - 492410746430
View all HP 12C#ABA manuals
Add to My Manuals
Save this manual to your list of manuals |
Page 60 highlights
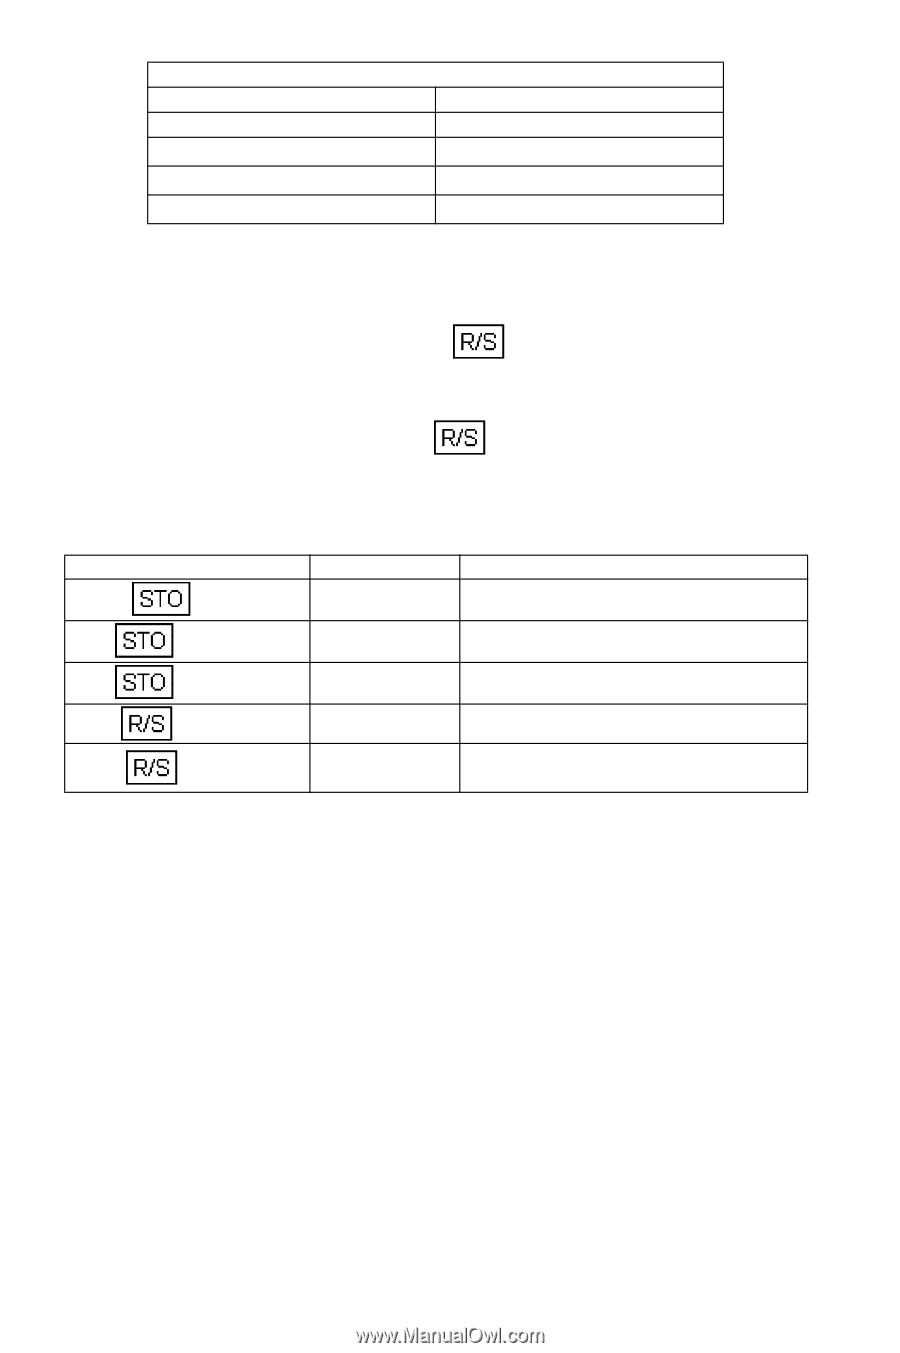
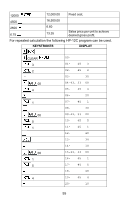
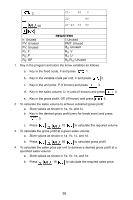
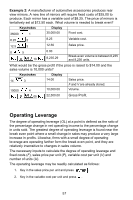
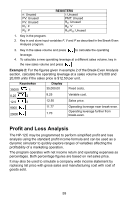
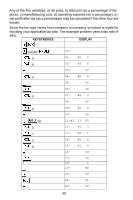
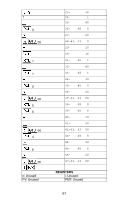
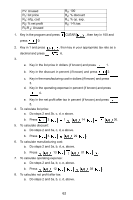
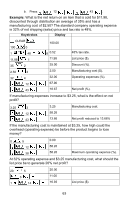
n: Unused PV: Unused FV: Unused R1: F R3: P REGISTERS i: Unused PMT: Unused R0: Unused R2: V R4-R.8: Unused 1. Key in the program. 2. Key in and store input variables F, V and P as described in the Break-Even Analysis program. 3. Key in the sales volume and press to calculate the operating leverage. 4. To calculate a new operating leverage at a different sales volume, key in the new sales volume and press Example 2: For the figures given in example 2 of the Break-Even Analysis section, calculate the operating leverage at a sales volume of 9,000 and 20,000 units if the sales price is $12.50 per unit. Keystrokes 35000 1 8.25 2 12.5 3 9000 20000 Display 35,000.00 8.25 12.50 11.77 1.70 Fixed costs. Variable cost. Sales price. Operating leverage near break-even. Operating leverage further from break-even. Profit and Loss Analysis The HP-12C may be programmed to perform simplified profit and loss analysis using the standard profit income formula and can be used as a dynamic simulator to quickly explore ranges of variables affecting the profitability of a marketing operation. The program operates with net income return and operating expenses as percentages. Both percentage figures are based on net sales price. It may also be used to simulate a company wide income statement by replacing list price with gross sales and manufacturing cost with cost of goods sold. 59
-
 1
1 -
2
-
3
-
4
-
5
-
6
-
7
-
8
-
9
-
10
-
11
-
12
-
13
-
14
-
15
-
16
-
17
-
18
-
19
-
20
-
21
-
22
-
23
-
24
-
25
-
26
-
27
-
28
-
29
-
30
-
31
-
32
-
33
-
34
-
35
-
36
-
37
-
38
-
39
-
40
-
41
-
42
-
43
-
44
-
45
-
46
-
47
-
48
-
49
-
50
-
51
-
52
-
53
-
54
-
 55
55 -
 56
56 -
 57
57 -
 58
58 -
 59
59 -
 60
60 -
 61
61 -
 62
62 -
 63
63 -
 64
64 -
 65
65 -
66
-
67
-
68
-
69
-
70
-
71
-
72
-
73
-
74
-
75
-
76
-
77
-
78
-
79
-
80
-
81
-
82
-
83
-
84
-
85
-
86
-
87
-
88
-
89
-
90
-
91
-
92
-
93
-
94
-
95
-
96
-
97
-
98
-
99
-
100
-
101
-
102
-
103
-
104
-
105
-
106
-
107
-
108
-
109
-
110
-
111
-
112
-
113
-
114
-
115
-
116
-
117
-
118
-
119
-
120
-
121
-
122
-
123
-
124
-
125
-
126
-
127
-
128
-
129
-
130
-
131
-
132
-
133
-
134
-
135
-
136
-
137
-
138
-
139
-
140
-
141
-
142
-
143
-
144
-
145
-
146
-
147
-
148
-
149
-
150
-
151
-
152
-
153
-
154
-
155
-
156
-
157
-
158
-
159
-
160
-
161
-
162
-
163
-
164
-
165
 |
 |