HP A7533A Brocade Web Tools Administrator's Guide - Supporting Fabric OS v5.3. - Page 155
Adding graphs to a canvas, Printing graphs
 |
UPC - 829160830858
View all HP A7533A manuals
Add to My Manuals
Save this manual to your list of manuals |
Page 155 highlights
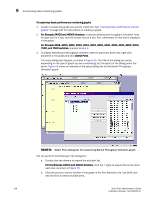
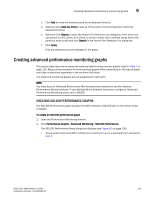
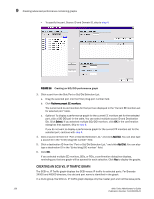
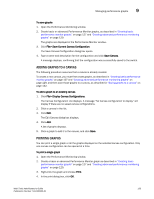
Managing performance graphs 9 To save graphs 1. Open the Performance Monitoring window. 2. Create basic or advanced Performance Monitor graphs, as described in "Creating basic performance monitor graphs" on page 127 and "Creating advanced performance monitoring graphs" on page 129. The graphs are displayed in the Performance Monitor window. 3. Click File> Save Current Canvas Configuration. The Save Canvas Configuration dialog box opens. 4. Type a name and description for the configuration and click Save Canvas. A message displays, confirming that the configuration was successfully saved to the switch. ADDING GRAPHS TO A CANVAS The following procedure assumes that a canvas is already created. To create a new canvas, you must first create graphs, as described in "Creating basic performance monitor graphs" on page 127 and "Creating advanced performance monitoring graphs" on page 129, and then save those graphs to a canvas, as described in "Saving graphs to a canvas" on page 132. To add a graph to an existing canvas 1. Click File> Display Canvas Configurations. The Canvas Configuration List displays. A message "No Canvas configuration to display" will display if there are no saved canvas configurations. 2. Click a canvas in the list. 3. Click Edit. The Edit Canvas dialog box displays. 4. Click Add. A list of graphs displays. 5. Click a graph to add it to the canvas, and click Save. PRINTING GRAPHS You can print a single graph or all the graphs displayed on the selected canvas configuration. Only one canvas configuration can be opened at a time. To print a single graph 1. Open the Performance Monitoring window. 2. Create a basic or advanced Performance Monitor graph as described in "Creating basic performance monitor graphs" on page 127 and "Creating advanced performance monitoring graphs" on page 129. 3. Right-click the graph and choose Print. 4. In the print dialog box, click OK. Web Tools Administrator's Guide 133 Publication Number: 53-1000435-01
-
 1
1 -
2
-
3
-
4
-
5
-
6
-
7
-
8
-
9
-
10
-
11
-
12
-
13
-
14
-
15
-
16
-
17
-
18
-
19
-
20
-
21
-
22
-
23
-
24
-
25
-
26
-
27
-
28
-
29
-
30
-
31
-
32
-
33
-
34
-
35
-
36
-
37
-
38
-
39
-
40
-
41
-
42
-
43
-
44
-
45
-
46
-
47
-
48
-
49
-
50
-
51
-
52
-
53
-
54
-
55
-
56
-
57
-
58
-
59
-
60
-
61
-
62
-
63
-
64
-
65
-
66
-
67
-
68
-
69
-
70
-
71
-
72
-
73
-
74
-
75
-
76
-
77
-
78
-
79
-
80
-
81
-
82
-
83
-
84
-
85
-
86
-
87
-
88
-
89
-
90
-
91
-
92
-
93
-
94
-
95
-
96
-
97
-
98
-
99
-
100
-
101
-
102
-
103
-
104
-
105
-
106
-
107
-
108
-
109
-
110
-
111
-
112
-
113
-
114
-
115
-
116
-
117
-
118
-
119
-
120
-
121
-
122
-
123
-
124
-
125
-
126
-
127
-
128
-
129
-
130
-
131
-
132
-
133
-
134
-
135
-
136
-
137
-
138
-
139
-
140
-
141
-
142
-
143
-
144
-
145
-
146
-
147
-
148
-
149
-
 150
150 -
 151
151 -
 152
152 -
 153
153 -
 154
154 -
 155
155 -
 156
156 -
 157
157 -
 158
158 -
 159
159 -
 160
160 -
161
-
162
-
163
-
164
-
165
-
166
-
167
-
168
-
169
-
170
-
171
-
172
-
173
-
174
-
175
-
176
-
177
-
178
-
179
-
180
-
181
-
182
-
183
-
184
-
185
-
186
-
187
-
188
-
189
-
190
-
191
-
192
-
193
-
194
-
195
-
196
-
197
-
198
-
199
-
200
-
201
-
202
-
203
-
204
-
205
-
206
-
207
-
208
-
209
-
210
-
211
-
212
-
213
-
214
-
215
-
216
-
217
-
218
-
219
-
220
-
221
-
222
-
223
-
224
-
225
-
226
-
227
-
228
-
229
-
230
-
231
-
232
-
233
-
234
-
235
-
236
-
237
-
238
-
239
-
240
-
241
-
242
-
243
-
244
-
245
-
246
-
247
-
248
-
249
-
250
-
251
-
252
-
253
-
254
-
255
-
256
-
257
-
258
-
259
-
260
-
261
-
262
-
263
-
264
-
265
-
266
 |
 |