HP P Class 450/500/550/600/650/700/750 hp visualize workstation - Graphics for - Page 9
Occlusion Culling - Why draw what you can't see?, Graphics Benchmarks and Application Performance
 |
View all HP P Class 450/500/550/600/650/700/750 manuals
Add to My Manuals
Save this manual to your list of manuals |
Page 9 highlights
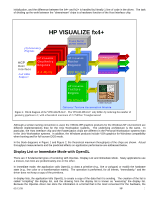
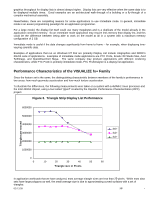
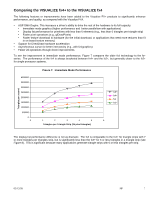
Figure 8. Display List Performance Triangles per second 5000000 4500000 4000000 3500000 3000000 2500000 2000000 1500000 1000000 500000 0 0 1 2 3 4 5 Triangles per Triangle Strip (25 pixel triangles) f x 6+ f x 4+ fx4 f x 2+ 6 . Occlusion Culling - Why draw what you can't see? HP is the first to introduce hardware occlusion testing in a personal workstation, and of all the unique features in VISUALIZE graphics, this is a feature worthy of a close look. Occlusion culling requires specific application modifications to take advantage of it. The idea is simple: before rendering a portion of a complex image that could contain thousands of polygons, first see if the object is already hidden by what was rendered before. The cost of the test involves checking if a bounding volume (think of it as a cube with 6 faces) is already occluded. Because of the round trip necessary to get the answer back from the hardware, it is more expensive than just rendering the 6 faces. The actual break-even point for doing the test will vary with the type of data and type of rendering being performed, but is roughly equivalent to drawing 190 25-pixel triangles on an fx6+, and only 65 25-pixel triangles on an fx2+. As the processor performance improves, the cost of the test will continue to go down. Applications written by EAI and Division are already taking advantage of this feature, with dramatic results. More applications will be released from other companies in the near future. This type of feature will be folded into a standard interface through the Fahrenheit large model efforts that involve cooperation between HP, Microsoft, and SGI. Graphics Benchmarks and Application Performance Especially with Windows NT, vendors are susceptible to quoting a single benchmark number. When comparing graphics systems, there is no substitute for benchmarking the actual application you plan to use. The most popular benchmark used in the last couple of years is the now-obsolete CDRS-03. CDRS is part of the Viewperf suite of benchmarks sponsored by OPC. The CDRS-03 benchmark had two distinguishing characteristics: 1) it is based on a Display-List application (the application has evolved into PTC Pro/Designer), and 2) it heavily weights anti-aliased lines. If the applications you plan to use are not display-list based, and you do not frequently view models using anti-aliased lines, then the CDRS-03 score is irrelevant. All the Viewperf tests (including CDRS) have a description of the model and the test, and how the test weights various graphics features. To use the Viewperf data, it is important to know which graphics features are used by your primary OpenGL applications, and then see which Viewperf test is closest to your application and workloads. Graphics benchmarks, even those based on the graphics output of real applications like Viewperf, don't simulate the actual characteristics of running the application on the system. For example, geometry accelerated devices (such as HP's fx+ series graphics) outperform non-geometry accelerated devices by more than Viewperf results would imply. The improvement is due to the combination of geometry acceleration and use of DMA to off-load the host CPU, allowing the application to process data in parallel with the graphics rendering. 03/12/99 HP 8
-
 1
1 -
2
-
3
-
 4
4 -
 5
5 -
 6
6 -
 7
7 -
 8
8 -
 9
9 -
 10
10
 |
 |
