HP StorageWorks MSA 2/8 HP StorageWorks Advanced Performance Monitoring V3.1.x - Page 49

Example 1., frame, and user-defined counters.

Page 49 highlights

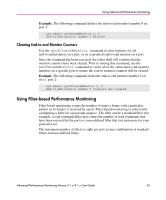
Using Advanced Performance Monitoring Example 1. The following command displays filter monitor traffic on port 2 at an interval of once every 5 seconds. In the command output, "#CMDs" refers to the read, write, and read-write counters, and "#Frames" refers to SCSI frame, IP frame, and user-defined counters. sw1:admin> perfShowFilterMonitor 2, 5 0 1 2 3 4 5 6 #CMDs #CMDs #CMDs #Frames #Frames #Frames #CMDs 0 0 0 0 0 0 0 26k 187 681 682 682 494 187 26k 177 711 710 710 534 176 26k 184 734 734 734 550 184 26k 182 649 649 649 467 182 26k 188 754 755 755 567 184 Example 2. The following command displays the cumulative frame count of all filter-based monitors defined on port 2. The KEY column lists the monitor numbers. sw1:admin> perfShowFilterMonitor 2 There are 7 filter-based monitors defined on port 2. KEY ALIAS OWNER_APP OWNER_IP_ADDR FRAME_COUNT 0 SCSI Read TELNET N/A 0x0000000000002208 1 SCSI Write TELNET N/A 0x000000000000464a 2 SCSI R/W TELNET N/A 0x000000000000fd8c 3 SCSI Frame WEB_TOOLS 192.168.169.40 0x00000000002c2229 4 IP Frame WEB_TOOLS 192.168.169.40 0x0000000000000492 5 FCP/IP WEB_TOOLS 192.168.169.40 0x0000000000000009 6 SCSI_RD WEB_TOOLS 192.168.161.140 0x000000000000023a Advanced Performance Monitoring Version 3.1.x/4.1.x User Guide 49

  • 1
  • 2
  • 3
  • 4
  • 5
  • 6
  • 7
  • 8
  • 9
  • 10
  • 11
  • 12
  • 13
  • 14
  • 15
  • 16
  • 17
  • 18
  • 19
  • 20
  • 21
  • 22
  • 23
  • 24
  • 25
  • 26
  • 27
  • 28
  • 29
  • 30
  • 31
  • 32
  • 33
  • 34
  • 35
  • 36
  • 37
  • 38
  • 39
  • 40
  • 41
  • 42
  • 43
  • 44
  • 45
  • 46
  • 47
  • 48
  • 49
  • 50
  • 51
  • 52
  • 53
  • 54
  • 55
  • 56
  • 57
  • 58
  • 59
  • 60
  • 61
  • 62
  • 63
  • 64
  • 65
  • 66
  • 67
  • 68
  • 69
  • 70
  • 71
  • 72
  • 73
  • 74
  • 75
  • 76
  • 77
  • 78
  • 79
  • 80
  • 81
  • 82
  • 83
  • 84
  • 85
  • 86

Using Advanced Performance Monitoring
49
Advanced Performance Monitoring Version 3.1.x/4.1.x User Guide
Example 1.
The following command displays filter monitor traffic on port 2 at an
interval of once every 5 seconds. In the command output, “#CMDs” refers to the
read, write, and read-write counters, and “#Frames” refers to SCSI frame, IP
frame, and user-defined counters.
Example 2.
The following command displays the cumulative frame count of all
filter-based monitors defined on port 2. The KEY column lists the monitor
numbers.
sw1:admin> perfShowFilterMonitor 2, 5
0
1
2
3
4
5
6
#CMDs
#CMDs
#CMDs
#Frames #Frames #Frames
#CMDs
-------------------------------------------------------------
0
0
0
0
0
0
0
26k
187
681
682
682
494
187
26k
177
711
710
710
534
176
26k
184
734
734
734
550
184
26k
182
649
649
649
467
182
26k
188
754
755
755
567
184
sw1:admin> perfShowFilterMonitor 2
There are 7 filter-based monitors defined on port 2.
KEY
ALIAS
OWNER_APP
OWNER_IP_ADDR
FRAME_COUNT
-------------------------------------------------------------
0
SCSI Read
TELNET
N/A
0x0000000000002208
1
SCSI Write TELNET
N/A
0x000000000000464a
2
SCSI R/W
TELNET
N/A
0x000000000000fd8c
3
SCSI Frame WEB_TOOLS
192.168.169.40 0x00000000002c2229
4
IP Frame
WEB_TOOLS
192.168.169.40 0x0000000000000492
5 FCP/IP
WEB_TOOLS
192.168.169.40 0x0000000000000009
6 SCSI_RD
WEB_TOOLS
192.168.161.140 0x000000000000023a