| Section |
Page |
| Manual conventions |
9 |
| Notice |
10 |
| 1 |
11 |
| On/off, cancel operations |
11 |
| To turn on |
11 |
| To cancel |
11 |
| To turn off |
11 |
| The display |
12 |
| To adjust the contrast |
12 |
| To clear the display |
12 |
| Parts of the display |
12 |
| NOTE |
12 |
| Annunciator |
13 |
| Description |
13 |
| The keyboard |
13 |
| Menu keys |
13 |
| Aplet control keys |
14 |
| Key |
14 |
| Meaning � |
14 |
| Entry/Edit keys |
15 |
| Key |
15 |
| Meaning (Continued) |
15 |
| Shifted keystrokes |
16 |
| Key |
16 |
| Description � |
16 |
| HELPWITH |
17 |
| Example |
17 |
| Math keys |
17 |
| . |
17 |
| HINT |
18 |
| Program commands |
18 |
| Inactive keys |
18 |
| Menus |
18 |
| To search a menu |
18 |
| To cancel a menu |
19 |
| Input forms |
19 |
| Reset input form values |
19 |
| Mode settings |
20 |
| HINT |
20 |
| Setting |
20 |
| Options � |
20 |
| Setting a mode |
22 |
| HINT |
22 |
| Aplets (E-lessons) |
22 |
| Aplet name |
23 |
| Use this aplet to explore: � |
23 |
| Quad Explorer aplet |
24 |
| HINT |
24 |
| Trig Explorer aplet |
25 |
| Aplet library |
26 |
| To open an aplet |
26 |
| Aplet views |
26 |
| Symbolic view |
26 |
| Plot view |
27 |
| Numeric view |
27 |
| Plot-Table view |
27 |
| Plot-Detail view |
27 |
| Overlay Plot view |
28 |
| Note view |
28 |
| Sketch view |
28 |
| Aplet view configuration |
28 |
| Plot Setup |
28 |
| Numeric Setup |
29 |
| Symbolic Setup |
29 |
| To change views |
29 |
| To save aplet configuration |
29 |
| Mathematical calculations |
29 |
| Where to start |
29 |
| Entering expressions |
29 |
| Example |
30 |
| Long results |
30 |
| Negative numbers |
30 |
| Scientific notation (powers of 10) |
30 |
| Example |
30 |
| Explicit and implicit multiplication |
31 |
| HINT |
31 |
| Parentheses |
31 |
| Entering... |
31 |
| Calculates... |
31 |
| Algebraic precedence order of evaluation |
32 |
| Largest and smallest numbers |
32 |
| Clearing numbers |
32 |
| Using previous results |
32 |
| To copy a previous line |
33 |
| To reuse the last result |
33 |
| To repeat a previous line |
33 |
| Example |
33 |
| HINT |
34 |
| Storing a value in a variable |
34 |
| Accessing the display history |
35 |
| Key |
35 |
| Function |
35 |
| Clearing the display history |
35 |
| Using fractions |
35 |
| Setting Fraction mode |
35 |
| Setting fraction precision |
36 |
| Fraction calculations |
37 |
| Converting decimals to fractions |
38 |
| Complex numbers |
39 |
| Complex results |
39 |
| To enter complex numbers |
39 |
| Storing complex numbers |
39 |
| Catalogs and editors |
40 |
| Catalog/Editor |
40 |
| Contents � |
40 |
| Aplet library () |
40 |
| Aplets. |
40 |
| Sketch editor ( sketch) |
40 |
| Sketches and diagrams, See Chapter 15, “Notes and sketches”. |
40 |
| List ( list) |
40 |
| Lists. In HOME, lists are enclosed in {}. See Chapter 14, “Lists”. |
40 |
| Matrix ( matrix) |
40 |
| One- and two-dimensional arrays. In HOME, arrays are enclosed in []. See Chapter 13, “Matrices”. |
40 |
| Notepad ( notepad) |
40 |
| Notes (short text entries). See Chapter 15, “Notes and sketches”. |
40 |
| Program ( progrm) |
40 |
| Programs that you create, or associated with user-defined aplets. See Chapter 16, “Programming”. |
40 |
| 2 |
41 |
| Aplet views |
41 |
| About the Symbolic view |
41 |
| Defining an expression (Symbolic view) |
41 |
| Evaluating expressions |
43 |
| In aplets |
43 |
| In HOME |
44 |
| SYMB view keys |
44 |
| Key |
44 |
| Meaning � |
44 |
| About the Plot view |
45 |
| Setting up the plot (Plot view setup) |
45 |
| Plot view settings |
46 |
| Field |
46 |
| Meaning � |
46 |
| Field |
46 |
| Meaning � |
46 |
| Reset plot settings |
47 |
| Exploring the graph |
47 |
| PLOT view keys |
47 |
| Key |
47 |
| Meaning � |
47 |
| Trace a graph |
48 |
| To move between relations |
48 |
| To jump directly to a value |
49 |
| To turn trace on/off |
49 |
| Zoom within a graph |
49 |
| ZOOM options |
49 |
| Option |
49 |
| Meaning � |
49 |
| Center |
49 |
| Box... |
49 |
| In |
49 |
| Out |
49 |
| X-Zoom In |
49 |
| X-Zoom Out |
49 |
| Y-Zoom In |
50 |
| Y-Zoom Out |
50 |
| Square |
50 |
| Set Factors... |
50 |
| Auto Scale |
50 |
| Decimal |
50 |
| Integer |
50 |
| Trig |
50 |
| Un-zoom |
51 |
| ZOOM examples |
51 |
| To box zoom |
52 |
| To set zoom factors |
53 |
| Other views for scaling and splitting the graph |
54 |
| VIEWS menu options |
54 |
| Option |
54 |
| Meaning � |
54 |
| Plot- Detail |
54 |
| Plot-Table |
54 |
| Overlay Plot |
54 |
| Auto Scale |
54 |
| Decimal |
54 |
| Integer |
54 |
| Trig |
55 |
| Split the screen |
55 |
| Overlay plots |
56 |
| Decimal scaling |
56 |
| Integer scaling |
56 |
| Trigonometric scaling |
56 |
| About the numeric view |
56 |
| Setting up the table (Numeric view setup) |
57 |
| Numeric view settings |
57 |
| Field |
57 |
| Meaning � |
57 |
| Reset numeric settings |
58 |
| Exploring the table of numbers |
58 |
| NUM view menu keys |
58 |
| Key |
58 |
| Meaning� |
58 |
| Zoom within a table |
58 |
| ZOOM options |
58 |
| Option |
58 |
| Meaning� |
58 |
| HINT |
59 |
| Automatic recalculation |
59 |
| Building your own table of numbers |
59 |
| Build a table |
59 |
| Clear data |
60 |
| “Build Your Own” menu keys |
60 |
| Key |
60 |
| Meaning |
60 |
| clear |
60 |
| Example: plotting a circle |
61 |
| 3 |
63 |
| About the Function aplet |
63 |
| Getting started with the Function aplet |
63 |
| Open the Function aplet |
63 |
| Define the expressions |
64 |
| Set up the plot |
64 |
| Plot the functions |
64 |
| Change the scale |
65 |
| Trace a graph |
65 |
| Analyse graph with FCN functions |
66 |
| To find a root of the quadratic function |
66 |
| To find the intersection of the two functions |
66 |
| To find the slope of the quadratic function |
67 |
| To find the signed area of the two functions |
67 |
| To find the extremum of the quadratic |
68 |
| HINT |
69 |
| Display the numeric view |
69 |
| Set up the table |
69 |
| Explore the table |
69 |
| To navigate around a table |
70 |
| To go directly to a value |
70 |
| To access the zoom options |
70 |
| To change font size |
70 |
| To display the symbolic definition of a column |
70 |
| Function aplet interactive analysis |
71 |
| Access FCN variables |
71 |
| FCN functions |
72 |
| Function |
72 |
| Description � |
72 |
| Shading area |
73 |
| Plotting a piecewise-defined function |
74 |
| 4 |
75 |
| About the Parametric aplet |
75 |
| Getting started with the Parametric aplet |
75 |
| Open the Parametric aplet |
75 |
| Define the expressions |
75 |
| Set angle measure |
76 |
| Set up the plot |
76 |
| Plot the expression |
76 |
| Overlay plot |
77 |
| Display the numbers |
77 |
| 5 |
79 |
| Getting started with the Polar aplet |
79 |
| Open the Polar aplet |
79 |
| Define the expression |
79 |
| Specify plot settings |
79 |
| Plot the expression |
79 |
| Explore the graph |
80 |
| Display the numbers |
80 |
| 6 |
81 |
| About the Sequence aplet |
81 |
| Getting started with the Sequence aplet |
81 |
| Open the Sequence aplet |
81 |
| Define the expression |
82 |
| Specify plot settings |
82 |
| Plot the sequence |
82 |
| Display the table |
83 |
| 7 |
85 |
| About the Solve aplet |
85 |
| Getting started with the Solve aplet |
86 |
| Open the Solve aplet |
86 |
| Define the equation |
86 |
| Enter known variables |
86 |
| HINT |
87 |
| Solve the unknown variable |
87 |
| Plot the equation |
87 |
| Solve aplet’s NUM view keys |
88 |
| Key |
88 |
| Meaning� |
88 |
| Use an initial guess |
89 |
| HINT |
89 |
| Number format |
89 |
| Interpreting results |
90 |
| Message |
90 |
| Condition |
90 |
| The initial guess lies outside the domain of the equation. Therefore, the solution was not a real... |
91 |
| The value of the equation is the same at every point sampled. |
91 |
| HINT |
91 |
| The Root-Finder at work |
91 |
| Plotting to find guesses |
91 |
| Using variables in equations |
94 |
| Home variables |
94 |
| HINT |
94 |
| Aplet variables |
94 |
| 8 |
95 |
| About the Statistics aplet |
95 |
| Getting started with the Statistics aplet |
95 |
| Advertising minutes (independent, x) |
95 |
| Resulting Sales ($) (dependent, y) |
95 |
| 2 |
95 |
| 1400 |
95 |
| 1 |
95 |
| 920 |
95 |
| 3 |
95 |
| 1100 |
95 |
| 5 |
95 |
| 2265 |
95 |
| 5 |
95 |
| 2890 |
95 |
| 4 |
95 |
| 2200 |
95 |
| Open the Statistics aplet |
96 |
| Enter data |
96 |
| Choose fit and data columns |
97 |
| Explore statistics |
97 |
| Setup plot |
98 |
| Plot the graph |
98 |
| Draw the regression curve |
98 |
| Display the equation for best linear fit |
98 |
| Predict values |
99 |
| Entering and editing statistical data |
100 |
| HINT |
100 |
| Statistics aplet’s NUM view keys |
100 |
| Key |
100 |
| Meaning � |
100 |
| Example |
101 |
| Key |
102 |
| Meaning � |
102 |
| Height (cm) |
103 |
| Frequency |
103 |
| 160 |
103 |
| 5 |
103 |
| 165 |
103 |
| 3 |
103 |
| 170 |
103 |
| 8 |
103 |
| 175 |
103 |
| 2 |
103 |
| 180 |
103 |
| 1 |
103 |
| Save data |
104 |
| Edit a data set |
105 |
| Delete data |
105 |
| Insert data |
105 |
| Sort data values |
105 |
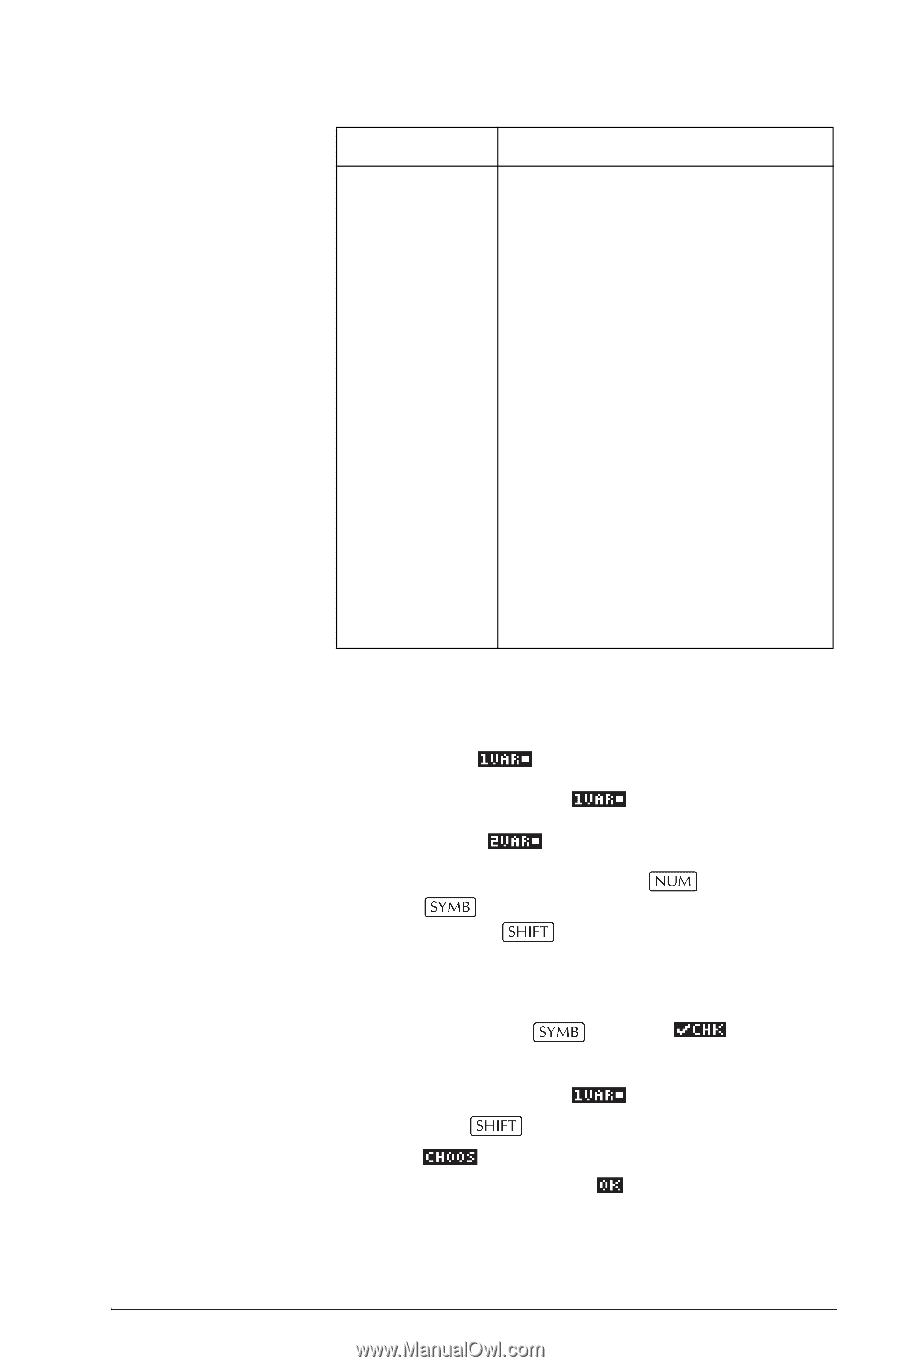
| Defining a regression model |
106 |
| Angle Setting |
106 |
| To choose the fit |
106 |
| Fit models |
106 |
| Fit model |
106 |
| Meaning � |
106 |
| To define your own fit |
107 |
| Computed statistics |
107 |
| One-variable |
107 |
| Statistic |
107 |
| Definition � |
107 |
| Two-variable |
108 |
| Statistic |
108 |
| Definition � |
108 |
| Plotting |
109 |
| To plot statistical data |
109 |
| Plot types |
110 |
| Histogram |
110 |
| Box and Whisker Plot |
110 |
| Scatter Plot |
110 |
| Fitting a curve to 2VAR data |
111 |
| Correlation coefficient |
111 |
| Relative Error |
111 |
| HINT |
112 |
| Setting up the plot (Plot setup view) |
112 |
| Plot type (1VAR) |
112 |
| Histogram width |
112 |
| Histogram range |
112 |
| Plotting mark (2VAR) |
112 |
| Connected points (2VAR) |
112 |
| Trouble-shooting a plot |
112 |
| Exploring the graph |
113 |
| Statistics aplet’s PLOT view keys |
113 |
| Key |
113 |
| Meaning � |
113 |
| Calculating predicted values |
114 |
| Find predicted values |
114 |
| HINT |
115 |
| 9 |
117 |
| About the Inference aplet |
117 |
| Example data |
117 |
| Getting started with the Inference aplet |
117 |
| Open the Inference aplet |
117 |
| Inference aplet’s SYMB view keys |
118 |
| Hypothesis Tests |
118 |
| Confidence Intervals |
118 |
| Select the inferential method |
119 |
| Enter data |
119 |
| Field name |
119 |
| Definition � |
119 |
| Display on-line help |
120 |
| Display test results in numeric format |
120 |
| Plot test results |
120 |
| Importing sample statistics from the Statistics aplet |
120 |
| Open the Statistics aplet |
121 |
| Enter data |
121 |
| HINT |
121 |
| Calculate statistics |
121 |
| Open Inference aplet |
122 |
| Select inference method and type |
122 |
| Set up the interval calculation |
122 |
| Import the data |
123 |
| Display Numeric view |
123 |
| Display Plot view |
123 |
| Hypothesis tests |
124 |
| One-Sample Z-Test |
124 |
| Menu name |
124 |
| Inputs |
124 |
| Field name |
124 |
| Definition |
124 |
| Results |
125 |
| Result |
125 |
| Description |
125 |
| Test Z |
125 |
| Prob |
125 |
| Critical Z |
125 |
| Critical |
125 |
| Two-Sample Z-Test |
125 |
| Menu name |
125 |
| Inputs |
125 |
| Field name |
125 |
| Definition |
125 |
| Results |
126 |
| Result |
126 |
| Description |
126 |
| One-Proportion Z-Test |
126 |
| Menu name |
126 |
| Inputs |
127 |
| Field name |
127 |
| Definition |
127 |
| Results |
127 |
| Result |
127 |
| Description |
127 |
| Two-Proportion Z-Test |
127 |
| Menu name |
127 |
| Inputs |
128 |
| Field name |
128 |
| Definition |
128 |
| Results |
128 |
| Result |
128 |
| Description |
128 |
| One-Sample T-Test |
128 |
| Menu name |
128 |
| Inputs |
129 |
| Field name |
129 |
| Definition |
129 |
| Results |
129 |
| Result |
129 |
| Description |
129 |
| Two-Sample T-Test |
130 |
| Menu name |
130 |
| Inputs |
130 |
| Field name |
130 |
| Definition |
130 |
| Results |
131 |
| Result |
131 |
| Description |
131 |
| Confidence intervals |
131 |
| One-Sample Z-Interval |
131 |
| Menu name |
131 |
| Inputs |
131 |
| Field name |
131 |
| Definition |
131 |
| Results |
132 |
| Result |
132 |
| Description � |
132 |
| Two-Sample Z-Interval |
132 |
| Menu name |
132 |
| Inputs |
132 |
| Field name |
132 |
| Definition |
132 |
| Results |
132 |
| Result |
132 |
| Description |
132 |
| One-Proportion Z-Interval |
133 |
| Menu name |
133 |
| Inputs |
133 |
| Field name |
133 |
| Definition |
133 |
| Results |
133 |
| Result |
133 |
| Description |
133 |
| Two-Proportion Z-Interval |
133 |
| Menu name |
133 |
| Inputs |
133 |
| Field name |
133 |
| Definition� |
133 |
| Results |
134 |
| Result |
134 |
| Description |
134 |
| One-Sample T-Interval |
134 |
| Menu name |
134 |
| Inputs |
134 |
| Field name |
134 |
| Definition |
134 |
| Results |
135 |
| Result |
135 |
| Description� |
135 |
| Two-Sample T-Interval |
135 |
| Menu name |
135 |
| Inputs |
135 |
| Field name |
135 |
| Definition |
135 |
| Results |
136 |
| Result |
136 |
| Description � |
136 |
| 10 |
137 |
| Background |
137 |
| Performing TVM calculations |
140 |
| Example 1 - Loan calculations |
141 |
| Example 2 - Mortgage with balloon payment |
142 |
| Calculating Amortizations |
143 |
| To calculate amortizations: |
143 |
| a Number of payments per year (P/YR) |
143 |
| b Payment at beginning or end of periods |
143 |
| Example 3 - Amortization for home mortgage |
143 |
| To continue amortizing the loan: |
143 |
| Example 4 - Amortization for home mortgage |
144 |
| To amortize a series of future payments starting at payment p: |
144 |
| 11 |
145 |
| Math functions |
145 |
| The MATH menu |
145 |
| To select a function |
145 |
| Function categories |
146 |
| Math functions by category |
146 |
| Syntax |
146 |
| Functions common to keyboard and menus |
146 |
| p |
146 |
| arg |
146 |
| and |
146 |
| ! |
147 |
| Â |
147 |
| eex |
147 |
| Keyboard functions |
147 |
| ,,, |
147 |
| ex |
147 |
| 10x |
148 |
| ,, |
148 |
| asin |
148 |
| acos |
148 |
| atan |
149 |
| abs |
149 |
| Calculus functions |
150 |
| TAYLOR |
151 |
| Complex number functions |
151 |
| ARG |
151 |
| CONJ |
151 |
| IM |
151 |
| RE |
151 |
| Constants |
152 |
| e |
152 |
| i |
152 |
| MAXREAL |
152 |
| MINREAL |
152 |
| p |
152 |
| Hyperbolic trigonometry |
152 |
| ACOSH |
152 |
| ASINH |
152 |
| ATANH |
152 |
| COSH |
152 |
| SINH |
152 |
| TANH |
153 |
| ALOG |
153 |
| EXP |
153 |
| EXPM1 |
153 |
| LNP1 |
153 |
| List functions |
153 |
| Loop functions |
153 |
| ITERATE |
153 |
| RECURSE |
154 |
| S |
154 |
| Matrix functions |
154 |
| Polynomial functions |
154 |
| POLYCOEF |
154 |
| POLYEVAL |
155 |
| POLYFORM |
155 |
| POLYROOT |
155 |
| HINT |
155 |
| Probability functions |
156 |
| COMB |
156 |
| PERM |
156 |
| RANDOM |
156 |
| HINT |
156 |
| UTPC |
156 |
| UTPF |
157 |
| UTPN |
157 |
| UTPT |
157 |
| Real-number functions |
157 |
| CEILING |
157 |
| DEGÆRAD |
157 |
| FLOOR |
157 |
| FNROOT |
158 |
| FRAC |
158 |
| HMSÆ |
158 |
| ÆHMS |
158 |
| INT |
158 |
| MANT |
158 |
| MAX |
159 |
| MIN |
159 |
| MOD |
159 |
| % |
159 |
| %CHANGE |
159 |
| %TOTAL |
159 |
| RADÆDEG |
159 |
| ROUND |
160 |
| SIGN |
160 |
| TRUNCATE |
160 |
| XPON |
160 |
| Two-variable statistics |
160 |
| Symbolic functions |
161 |
| = (equals) |
161 |
| ISOLATE |
161 |
| LINEAR? |
161 |
| QUAD |
161 |
| QUOTE |
162 |
| | (where) |
162 |
| Test functions |
162 |
| < |
162 |
| £ |
162 |
| = = |
162 |
| ¹ |
162 |
| > |
162 |
| ³ |
163 |
| AND |
163 |
| IFTE |
163 |
| NOT |
163 |
| OR |
163 |
| XOR |
163 |
| Trigonometry functions |
163 |
| ACOT |
163 |
| ACSC |
163 |
| ASEC |
163 |
| COT |
163 |
| CSC |
163 |
| SEC |
164 |
| Symbolic calculations |
164 |
| In HOME |
164 |
| Using formal variables |
164 |
| Symbolic calculations in the Function aplet |
165 |
| Finding derivatives |
165 |
| To find derivatives in HOME |
165 |
| To find derivatives in the Function aplet’s Symbolic view |
166 |
| To find the indefinite integral using formal variables |
167 |
| 12 |
169 |
| Introduction |
169 |
| Storing and recalling variables |
170 |
| Numeric Precision |
170 |
| To store a value |
170 |
| To store the results of a calculation |
170 |
| To recall a value |
171 |
| To use variables in calculations |
171 |
| The VARS menu |
172 |
| Example |
173 |
| Home variables |
175 |
| Category |
175 |
| Available names � |
175 |
| Aplet variables |
176 |
| Category |
176 |
| Available names |
176 |
| To access an aplet variable |
176 |
| Memory Manager |
177 |
| Example |
177 |
| 13 |
179 |
| Introduction |
179 |
| Vectors |
179 |
| Matrices |
179 |
| Matrix Variables |
179 |
| Creating and storing matrices |
180 |
| Matrix Catalog keys |
180 |
| Key |
180 |
| Meaning � |
180 |
| To create a matrix in the Matrix Catalog |
181 |
| To transmit a matrix |
182 |
| Working with matrices |
182 |
| To edit a matrix |
182 |
| Matrix edit keys |
182 |
| Key |
182 |
| Meaning � |
182 |
| To display a matrix |
183 |
| To display one element |
183 |
| To create a matrix in HOME |
183 |
| To store one element |
184 |
| Matrix arithmetic |
184 |
| Example |
184 |
| To multiply and divide by a scalar |
185 |
| To multiply two matrices |
185 |
| To divide by a square matrix |
185 |
| To invert a matrix |
186 |
| To negate each element |
186 |
| Solving systems of linear equations |
186 |
| Example |
186 |
| Matrix functions and commands |
187 |
| About functions |
187 |
| About commands |
188 |
| Argument conventions |
188 |
| Matrix functions |
188 |
| COLNORM |
188 |
| COND |
188 |
| CROSS |
188 |
| DET |
189 |
| DOT |
189 |
| EIGENVAL |
189 |
| EIGENVV |
189 |
| IDENMAT |
189 |
| INVERSE |
189 |
| LQ |
189 |
| LSQ |
189 |
| LU |
189 |
| MAKEMAT |
189 |
| QR |
190 |
| RANK |
190 |
| ROWNORM |
190 |
| RREF |
190 |
| SCHUR |
190 |
| SIZE |
190 |
| SPECNORM |
190 |
| SPECRAD |
190 |
| SVD |
191 |
| SVL |
191 |
| TRACE |
191 |
| TRN |
191 |
| Examples |
191 |
| Identity Matrix |
191 |
| Transposing a Matrix |
191 |
| Reduced-Row Echelon Form |
192 |
| 14 |
193 |
| Create a list in the List Catalog |
193 |
| List catalog keys |
194 |
| Key |
194 |
| Meaning � |
194 |
| List edit keys |
195 |
| Key |
195 |
| Meaning � |
195 |
| Create a list in HOME |
195 |
| Displaying and editing lists |
196 |
| To display a list |
196 |
| To display one element |
196 |
| To edit a list |
196 |
| To insert an element in a list |
197 |
| To store one element |
197 |
| Deleting lists |
198 |
| To delete a list |
198 |
| To delete all lists |
198 |
| Transmitting lists |
198 |
| List functions |
198 |
| CONCAT |
199 |
| DLIST |
199 |
| MAKELIST |
200 |
| PLIST |
200 |
| POS |
200 |
| REVERSE |
200 |
| SIZE |
201 |
| SLIST |
201 |
| SORT |
201 |
| Finding statistical values for list elements |
201 |
| Example |
201 |
| 15 |
203 |
| Introduction |
203 |
| Aplet note view |
203 |
| To write a note in Note view |
203 |
| Note edit keys |
204 |
| Key |
204 |
| Meaning � |
204 |
| cmds |
204 |
| chars |
204 |
| Aplet sketch view |
205 |
| Sketch keys |
205 |
| Key |
205 |
| Meaning � |
205 |
| To draw a line |
205 |
| To draw a box |
206 |
| To draw a circle |
206 |
| DRAW keys |
206 |
| Key |
206 |
| Meaning � |
206 |
| To label parts of a sketch |
207 |
| To create a set of sketches |
207 |
| To store into a graphics variable |
207 |
| To import a graphics variable |
208 |
| The notepad |
208 |
| To create a note in the Notepad |
208 |
| Notepad Catalog keys |
209 |
| Key |
209 |
| Meaning � |
209 |
| To import a note |
210 |
| 16 |
211 |
| Introduction |
211 |
| HINT |
211 |
| The Contents of a Program |
211 |
| Structured Programming |
211 |
| Example |
212 |
| Program catalog |
212 |
| Open Program Catalog |
212 |
| Program catalog keys |
213 |
| Key |
213 |
| Meaning � |
213 |
| Creating and editing programs |
214 |
| Create a new program |
214 |
| Enter commands |
214 |
| Edit a program |
215 |
| Editing keys |
216 |
| Key |
216 |
| Meaning � |
216 |
| Using programs |
217 |
| Run a program |
217 |
| Debug a program |
217 |
| Stop a program |
217 |
| Copy a program |
218 |
| HINT |
218 |
| Transmit a program |
218 |
| Delete a program |
219 |
| Delete all programs |
219 |
| Delete the contents of a program |
219 |
| Customizing an aplet |
219 |
| Aplet naming convention |
220 |
| Example |
220 |
| Save the aplet |
221 |
| Configuring the Setviews menu option programs |
221 |
| Programming commands |
223 |
| Aplet commands |
224 |
| CHECK |
224 |
| SELECT |
224 |
| SETVIEWS |
224 |
| UNCHECK |
227 |
| Branch commands |
227 |
| IF...THEN...END |
227 |
| IF... THEN... ELSE... END |
228 |
| CASE...END |
228 |
| IFERR... THEN... END... |
228 |
| RUN |
229 |
| STOP |
229 |
| Drawing commands |
229 |
| ARC |
229 |
| BOX |
229 |
| Draws a box with diagonally opposite corners (x1,y1) and (x2,y2). |
229 |
| BOX x1;y1;x2;y2: |
229 |
| ERASE |
230 |
| FREEZE |
230 |
| LINE |
230 |
| PIXOFF |
230 |
| PIXON |
230 |
| TLINE |
230 |
| Graphic commands |
230 |
| DISPLAYÆ |
230 |
| ÆDISPLAY |
231 |
| ÆGROB |
231 |
| GROBNOT |
231 |
| GROBOR |
231 |
| GROBXOR |
231 |
| MAKEGROB |
231 |
| PLOTÆ |
231 |
| ÆPLOT |
232 |
| REPLACE |
232 |
| SUB |
232 |
| ZEROGROB |
232 |
| Loop commands |
232 |
| DO…UNTIL …END |
232 |
| WHILE… REPEAT… END |
233 |
| FOR…TO…STEP ...END |
233 |
| BREAK |
233 |
| Matrix commands |
233 |
| ADDCOL |
233 |
| ADDROW |
233 |
| DELCOL |
234 |
| DELROW |
234 |
| EDITMAT |
234 |
| RANDMAT |
234 |
| REDIM |
234 |
| REPLACE |
234 |
| SCALE |
234 |
| SCALEADD |
234 |
| SUB |
235 |
| SWAPCOL |
235 |
| SWAPROW |
235 |
| Print commands |
235 |
| PRDISPLAY |
235 |
| PRHISTORY |
235 |
| PRVAR |
235 |
| Prompt commands |
235 |
| BEEP |
235 |
| CHOOSE |
236 |
| DISP |
236 |
| DISPTIME |
236 |
| EDITMAT |
237 |
| FREEZE |
237 |
| GETKEY |
237 |
| INPUT |
237 |
| MSGBOX |
238 |
| PROMPT |
238 |
| WAIT |
238 |
| Stat-One and Stat-Two commands |
238 |
| Stat-One commands |
239 |
| DO1VSTATS |
239 |
| SETFREQ |
239 |
| SETSAMPLE |
239 |
| Stat-Two commands |
239 |
| DO2VSTATS |
239 |
| SETDEPEND |
239 |
| SETINDEP |
239 |
| Storing and retrieving variables in programs |
240 |
| Plot-view variables |
240 |
| Area Function |
240 |
| Axes All Aplets |
240 |
| Connect Function Parametric Polar Solve Statistics |
240 |
| Coord Function Parametric Polar Sequence Solve Statistics |
241 |
| Extremum Function |
241 |
| FastRes Function Solve |
241 |
| Grid All Aplets |
241 |
| Hmin/Hmax Statistics |
241 |
| Hwidth Statistics |
242 |
| Indep All Aplets |
242 |
| InvCross All Aplets |
242 |
| Isect Function |
242 |
| Labels All Aplets |
242 |
| Nmin / Nmax Sequence |
243 |
| Recenter All Aplets |
243 |
| Root Function |
243 |
| S1mark–S5mark Statistics |
243 |
| SeqPlot Sequence |
243 |
| Simult Function Parametric Polar Sequence |
244 |
| Slope Function |
244 |
| StatPlot Statistics |
244 |
| Umin/Umax Polar |
244 |
| Ustep Polar |
244 |
| Tmin / Tmax Parametric |
245 |
| Tracing All Aplets |
245 |
| Tstep Parametric |
245 |
| Xcross All Aplets |
245 |
| Ycross All Aplets |
245 |
| Xtick All Aplets |
246 |
| Ytick All Aplets |
246 |
| Xmin / Xmax All Aplets |
246 |
| Ymin / Ymax All Aplets |
246 |
| Xzoom All Aplets |
247 |
| Yzoom All Aplets |
247 |
| Symbolic-view variables |
247 |
| Angle All Aplets |
247 |
| F1...F9, F0 Function |
247 |
| X1, Y1...X9,Y9 X0,Y0 Parametric |
247 |
| R1...R9, R0 Polar |
248 |
| U1...U9, U0 Sequence |
248 |
| E1...E9, E0 Solve |
248 |
| S1fit...S5fit Statistics |
248 |
| Numeric-view variables |
249 |
| C1...C9, C0 Statistics |
249 |
| Digits All Aplets |
249 |
| Format All Aplets |
249 |
| NumCol All Aplets except Statistics aplet |
250 |
| NumFont Function Parametric Polar Sequence Statistics |
250 |
| NumIndep Function Parametric Polar Sequence |
250 |
| NumRow All Aplets except Statistics aplet |
250 |
| NumStart Function Parametric Polar Sequence |
250 |
| NumStep Function Parametric Polar Sequence |
251 |
| NumType Function Parametric Polar Sequence |
251 |
| NumZoom Function Parametric Polar Sequence |
251 |
| StatMode Statistics |
251 |
| Note variables |
252 |
| NoteText All Aplets |
252 |
| Sketch variables |
252 |
| Page All Aplets |
252 |
| PageNum All Aplets |
252 |
| 17 |
253 |
| Creating new aplets based on existing aplets |
253 |
| Example |
253 |
| Using a customized aplet |
255 |
| Resetting an aplet |
255 |
| Annotating an aplet with notes |
256 |
| Annotating an aplet with sketches |
256 |
| HINT |
256 |
| Downloading e-lessons from the web |
256 |
| Sending and receiving aplets |
256 |
| To transmit an aplet |
257 |
| 2. Sending calculator: Open the Library, highlight the aplet to send, and press . |
257 |
| 3. Receiving calculator: Open the aplet library and press . |
257 |
| Sorting items in the aplet library menu list |
257 |
| To sort the aplet list |
258 |
| To delete an aplet |
258 |
| Glossary |
259 |
| Resetting the hp�39g+ |
261 |
| To reset using the keyboard |
261 |
| To erase all memory and reset defaults |
261 |
| If the calculator does not turn on |
262 |
| Operating details |
262 |
| Batteries |
262 |
| To install the main batteries |
263 |
| To install the backup battery |
263 |
| The Netherlands |
264 |
| Variables |
264 |
| Home variables |
264 |
| Category |
264 |
| Available name � |
264 |
| Ans Date HAngle HDigits HFormat Ierr Time |
264 |
| Function aplet variables |
265 |
| Category |
265 |
| Available name � |
265 |
| Axes Connect Coord FastRes Grid Indep InvCross Labels Recenter Simult Tracing |
265 |
| Xcross Ycross Xtick Ytick Xmin Xmax Ymin Ymax Xzoom Yxoom |
265 |
| Area Extremum Isect |
265 |
| Root Slope |
265 |
| Angle F1 F2 F3 F4 F5 |
265 |
| F6 F7 F8 F9 F0 |
265 |
| Digits Format NumCol NumFont NumIndep |
265 |
| NumRow NumStart NumStep NumType NumZoom |
265 |
| Parametric aplet variables |
266 |
| Category |
266 |
| Available name � |
266 |
| Axes Connect Coord Grid Indep InvCross Labels Recenter Simult Tmin Tmax |
266 |
| Tracing Tstep Xcross Ycross Xtick Ytick Xmin Xmax Ymin Ymax Xzoom Yzoom |
266 |
| Angle X1 Y1 X2 Y2 X3 Y3 X4 Y4 X5 |
266 |
| Y5 X6 Y6 X7 Y7 X8 Y8 X9 Y9 X0 Y0 |
266 |
| Digits Format NumCol NumFont NumIndep |
266 |
| NumRow NumStart NumStep NumType NumZoom |
266 |
| NoteText |
266 |
| Page |
266 |
| PageNum |
266 |
| Polar aplet variables |
267 |
| Category |
267 |
| Available names � |
267 |
| Axes Connect Coord Grid Indep InvCross Labels Recenter Simult Umin Umax qstep Tracing |
267 |
| Xcross Ycross Xtick Ytick Xmin Xmax Ymin Ymax Xzoom Yxoom |
267 |
| Angle R1 R2 R3 R4 R5 |
267 |
| R6 R7 R8 R9 R0 |
267 |
| Digits Format NumCol NumFont NumIndep |
267 |
| NumRow NumStart NumStep NumType NumZoom |
267 |
| NoteText |
267 |
| Page |
267 |
| PageNum |
267 |
| Sequence aplet variables |
268 |
| Category |
268 |
| Available name � |
268 |
| Solve aplet variables |
269 |
| Category |
269 |
| Available name |
269 |
| Statistics aplet variables |
270 |
| Category |
270 |
| Available name |
270 |
| Axes Connect Coord Grid Hmin Hmax Hwidth Indep InvCross Labels Recenter S1mark S2mark S3mark |
270 |
| S4mark S5mark StatPlot Tracing Xcross Ycross Xtick Ytick Xmin Xmax Ymin Ymax Xzoom Yxoom |
270 |
| Angle S1fit S2fit |
270 |
| S3fit S4fit S5fit |
270 |
| C0,...C9 Digits Format NumCol |
270 |
| NumFont NumRow StatMode |
270 |
| Corr Cov Fit MeanX MeanY RelErr |
270 |
| SX SX2 SXY SY SY2 |
270 |
| MATH menu categories |
271 |
| Math functions |
271 |
| Category |
271 |
| Available name � |
271 |
| TAYLOR |
271 |
| ARG CONJ |
271 |
| IM RE |
271 |
| MAXREAL MINREAL p |
271 |
| POLYCOEF POLYEVAL |
272 |
| POLYFORM POLYROOT |
272 |
| PREDX PREDY |
272 |
| = ISOLATE LINEAR? |
272 |
| QUAD QUOTE | |
272 |
| AND IFTE NOT OR XOR |
273 |
| ACOT ACSC ASEC |
273 |
| COT CSC SEC |
273 |
| Program constants |
273 |
| Category |
273 |
| Available name � |
273 |
| Degrees Grads Radians |
273 |
| Standard Fixed |
273 |
| Sci Eng Fraction |
273 |
| Cobweb Stairstep |
273 |
| Linear LogFit ExpFit Power |
273 |
| QuadFit Cubic Logist User |
273 |
| Stat1Var Stat2Var |
273 |
| Hist BoxW |
273 |
| Program commands |
274 |
| Category |
274 |
| Command � |
274 |
| CHECK SELECT SETVIEWS UNCHECK |
274 |
| IF THEN ELSE END |
274 |
| CASE IFERR RUN STOP |
274 |
| ARC BOX ERASE FREEZE |
274 |
| LINE PIXOFF PIXON TLINE |
274 |
| DISPLAYÆ ÆDISPLAY ÆGROB GROBNOT GROBOR GROBXOR |
274 |
| MAKEGROB PLOTÆ ÆPLOT REPLACE SUB ZEROGROB |
274 |
| FOR = TO STEP END DO |
274 |
| UNTIL END WHILE REPEAT END BREAK |
274 |
| ADDCOL ADDROW DELCOL DELROW EDITMAT RANDMAT |
274 |
| REDIM REPLACE SCALE SCALEADD SUB SWAPCOL SWAPROW |
274 |
| PRDISPLAY PRHISTORY PRVAR |
274 |
| BEEP CHOOSE DISP DISPTIME EDITMAT FREEZE |
274 |
| GETKEY INPUT MSGBOX PROMPT WAIT |
274 |
| DO1VSTATS RANDSEED |
274 |
| SETFREQ SETSAMPLE |
274 |
| Status messages |
275 |
| Message |
275 |
| Meaning (Continued) |
275 |
| Service |
279 |
| Regulatory information |
281 |
| USA |
281 |
| Connections to Peripheral Devices |
281 |
| Canada |
281 |

 1
1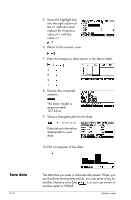 104
104 105
105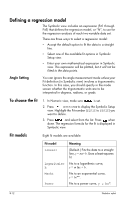 106
106 107
107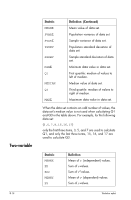 108
108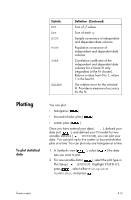 109
109 110
110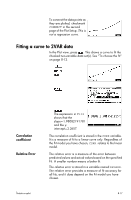 111
111 112
112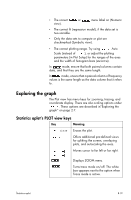 113
113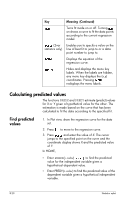 114
114